A morning radar for the ASX

The night’s ASX filings —The night’s ASX announcements,
read and counted before the open.

MacroDesk reads the company announcements filed on the ASX, puts what changed since the last session first, and shows how often similar filings were followed by a sharp move: each line with its count, its dates and its source filing. It describes; it does not advise.MacroDesk reads the announcements ASX companies file, puts what changed since the last session first, and shows how often similar announcements were followed by a big price move: each line with how often, when, and a link to the filing. It describes; it does not advise.

or flip the read →
Pricing at launch.
Reading the scanner
SurpriseHow far the result beat or missed the forecast.
ReactionHow the price moved after the filing, ranked against the stock’s own past reactions.How the share price moved after the announcement, ranked against how it moved after its past ones.
Base rateTrack recordOf similar past filings, how many were followed by a sharp move at the next session, with the count (n) and the dates. A record of the past, not a forecast.Of similar past announcements, how many were followed by a big move the next day, with how many there were and when. What happened before, not a prediction.
SourceEvery fact links to the filing it came from.Every fact links to the announcement it came from.
Analyst ⇄ Retail. The same facts in your language. Flip the toggle on the card and every label and note rewrites.
EXAMPLE ONLY · MADE-UP NUMBERS · NOT ADVICE
Read the whole card in your languageevery label & note rewrites live; try it
NVIDIA CorpNASDAQ: NVDA
Chipmakers · Very large companyReported after the market closed · updated 2 hours agoPast reports on file · 12 reports
Third-quarter (Q3) FY26 results: earnings per share, revenue and data-center sales beat forecasts; next-quarter (Q4) outlook raised.
MetricActualForecastSurprise
Earnings per share (adj.)$1.45$1.31+10.7%
Revenue$57.0B$54.8B+4.0%
Data-center revenue$50.1B$48.3B+3.7%
Next-quarter revenue outlook (mid)$63.0B$61.5Babove
+8.4%post-result · 78th pctile vs NVDA’s own earnings reactionsafter the report · a bigger jump than 78% of its past earnings moves
The day after its last 12 reports+1.2%up 7 times out of 12
−7.1%+11.4%
The median move and the middle half of outcomes after its last 12 reports. A record, not an estimate of this one.The typical move and the middle half of outcomes after its last 12 reports. What happened before, not a prediction for this one.
Beat & raise, reaction +8.4%. After its last 12 reports the next session was higher 7 times; the sizes varied more than the direction.A strong beat-and-raise; the stock rose 8.4%. After its last 12 reports it rose the next day 7 times out of 12, and the size of the moves varied more than their direction.
Full read — surprise, history, volatility, briefOpen the full read▾
Earnings surprise
+10.7%
above the ~10% band where surprise size historically mattersa beat this big has tended to matter more than a small one
How big the move was
Bigger than 78% of past moves
vs its own last 12 earnings reactionscompared with its last 12 earnings reports
TypeEarnings, beat & raise · giant chipmakers
What happened after past reportsNVDA · last 12 reports▾
Cohort: NVDA, last 12 earnings. Historical record, not a forecast of this one.Based on NVIDIA’s last 12 earnings reports. A track record, not a prediction of this one.
Higher, next day58%
Lower, next day42%
After-hours move held to close58%
Typical next-day move+1.2%
Range of outcomes (middle half)−7.1% / +11.4%
Sample12 reports (one company)
Size, not direction. Larger surprises (this one is +10.7%) have historically coincided with bigger moves, not a more reliable direction. The median next-session move is small relative to the day-one reaction.A bigger surprise like this one (+10.7%) has gone with a bigger move, not a more certain direction. The typical next-day move is small next to the after-hours jump.
An example built from replayed history, not real investor returns. One company, small sample. Past performance is not indicative of future performance.
How much it swings & context▾
Move priced into options before the report±9.0%
How much it swung over 30 days~52%
Weight in the indexLarge · moves the chip index (SOX) and the Nasdaq-100

Big moves either way are common around earnings, and the swing priced into options usually drops sharply afterward (the “IV crush”). Heavily traded, with a small gap between buy and sell prices, but a single stock that swings more than the market.

Desk briefanalyst voiceretail voice

Beat & raise — EPS $1.45 vs $1.31 (+10.7%), revenue $57.0B (+4.0%), data-center $50.1B; Q4 guide above consensus. Reaction +8.4% (78th pctile vs its own history). Across the last 12 prints the session-after move was higher in 7 of 12 (58%), median +1.2%; surprises beyond ~10% have coincided with larger magnitude moves but not a more reliable direction, and the after-hours move held into the next close in 7 of 12. Dispersion wide (IQR −7.1% / +11.4%).

NVIDIA beat on earnings and revenue and guided next quarter above forecasts; the stock is up 8.4% on the result. Across its last 12 earnings it was higher the following session 7 times out of 12 (58%), with a small typical move of around +1.2%. Bigger surprises like this one (above 10%) have gone with bigger moves, but not more predictable ones in direction, and the after-hours jump held into the next day’s close 7 times out of 12. The range of past outcomes was wide.

Source: example · company release & forecasts · MacroDesk replay set · How this is calculated ›
General information only, not financial advice. Made-up data for design purposes, not real NVIDIA figures. Historical / example only, not a prediction. A single stock that swings more than the market; large moves in both directions are common. Does not consider your objectives, financial situation or needs.
The dashboard · your first screen

Open MacroDesk and the market is already read.

Regime, geopolitical risk, the desk brief and a live alerts rail. The whole picture, assembled the moment you log in.The market regime, world-events risk, the desk brief and a live list of alerts. The whole picture, put together the moment you log in.
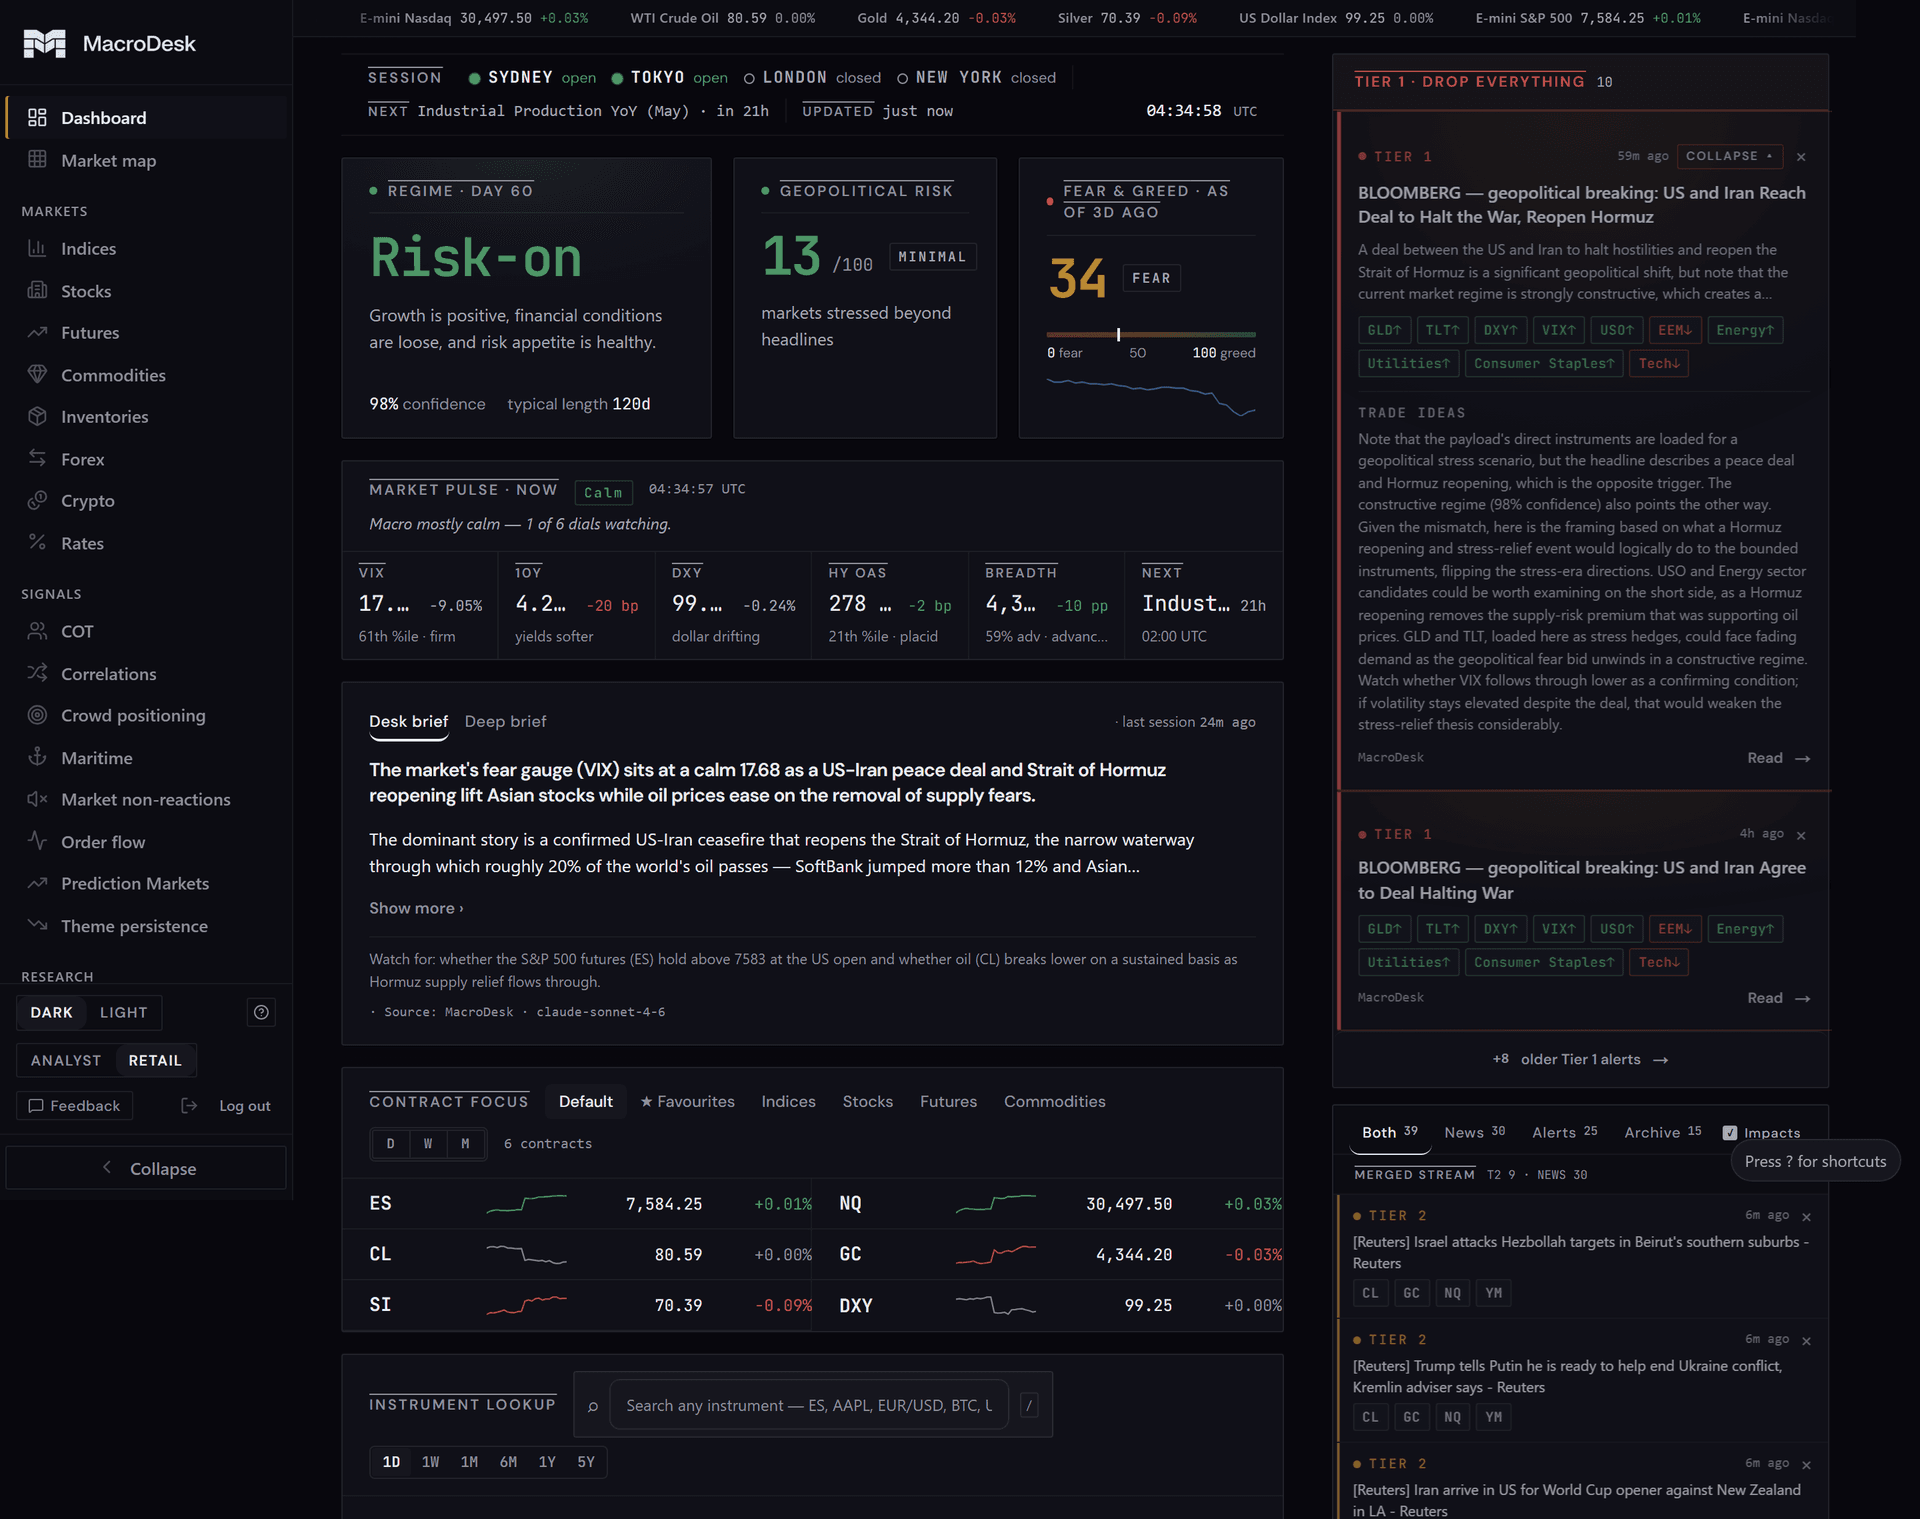
app.macrodesk.io/dashboardLIVE · DARK
MacroDesk dashboard: the market regime, world-events risk, fear & greed, the desk brief and a live list of alerts
This is the home screen —This is the home screen: one surface, the entire market already interpreted.
The gap

Speed isn’t a signal. Knowing it happened isn’t knowing what it means.

It’s 8:31. The print hit. Your news feed lit up, two chat rooms are already arguing, and the chart has moved. You have every fact on a screen somewhere — and no read on any of it.It’s 8:31. The data just came out. Your news feed lit up, two chat rooms are already arguing, and the chart has moved. You have every fact on a screen somewhere, and no read on any of it.

Five subscriptions, zero synthesisFive subscriptions, nothing joined upEach tool shows you a slice. None of them tells you what the slices add up to.
Context arrives too lateBy the time you’ve pulled the regime, the spillover and the history by hand, the move is half over.By the time you’ve looked up the market regime, the knock-on effects and the history by hand, the move is half over.
Verdicts with no workingCalls with no reasoningA buy or a sell arrives with no reasoning attached — nothing to pressure-test, and no line for when it’s wrong.A buy or a sell arrives with no reasoning attached. Nothing to test, and no line for when it’s wrong.

You are the integration layer.You are the one joining it all up. That’s the job MacroDesk retires.

One morning, workedOne morning, step by step

CPI drops at 8:30.Inflation data (CPI) drops at 8:30.
Here’s 8:31.

The first three minutes, when the desk does the assembling instead of you.

08:30:00

The print lands.The data comes out.

Actual, consensus, prior and the surprise. One row, flagged the second it drops. The alerts rail fires.The actual number, the forecast, the last reading and the surprise. One row, flagged the second it drops. The alerts feed fires. No tab two.No second tab.

US CPI YOY — ACTUAL 3.4% · CONSENSUS 3.2% · PRIOR 3.1%
SURPRISE · HOT
TIER 1 · DROP EVERYTHINGCPI upside surprise. Front-end repricing under way.
08:30:45

The read is on screen.

The print against consensus, what moved in the first minute, and what followed similar prints before, with the count, in your choice of voice.The number against the forecast, what moved in the first minute, and what followed similar releases before, with how often, in your choice of voice.

ANALYST
Core above consensus; front-end yields repriced higher inside the first minute.
RETAIL
Inflation came in above forecasts, and short-term bond yields rose within the first minute.
SEEN BEFOREBEFORE
Past hot core prints: what the 2-year did in the first hour, counted, with n and the dates.
Showing the analyst voiceShowing the retail voice — set by the Analyst / Retail toggle up the page(set by the Analyst / Retail toggle up the page)
08:31:30

Context is already attached.

The regime call, fragility, and follow-on effects: what a print like this tends to drag with it across rates, the dollar, gold and equities.The market regime call, how fragile things are, and the knock-on effects: what a data release like this tends to drag with it across interest rates, the dollar, gold and shares.

REGIME · FRAGILITY · FOLLOW-ON EFFECTS · CORRELATIONSREGIME · FRAGILITY · KNOCK-ON EFFECTS · MOVING TOGETHER
08:33:00

You make the call. Or you stand down.You make the call. Or you sit it out.

Either way, you know why. Tabs opened: zero.

One screen. The same minute. The reasoning attached.
ILLUSTRATIVE EXAMPLE · DECISION-SUPPORT, NOT FINANCIAL ADVICEEXAMPLE ONLY · HELPS YOU DECIDE, NOT FINANCIAL ADVICE
See it in action

Every surface reads the marketEvery page reads the market and explains itself.

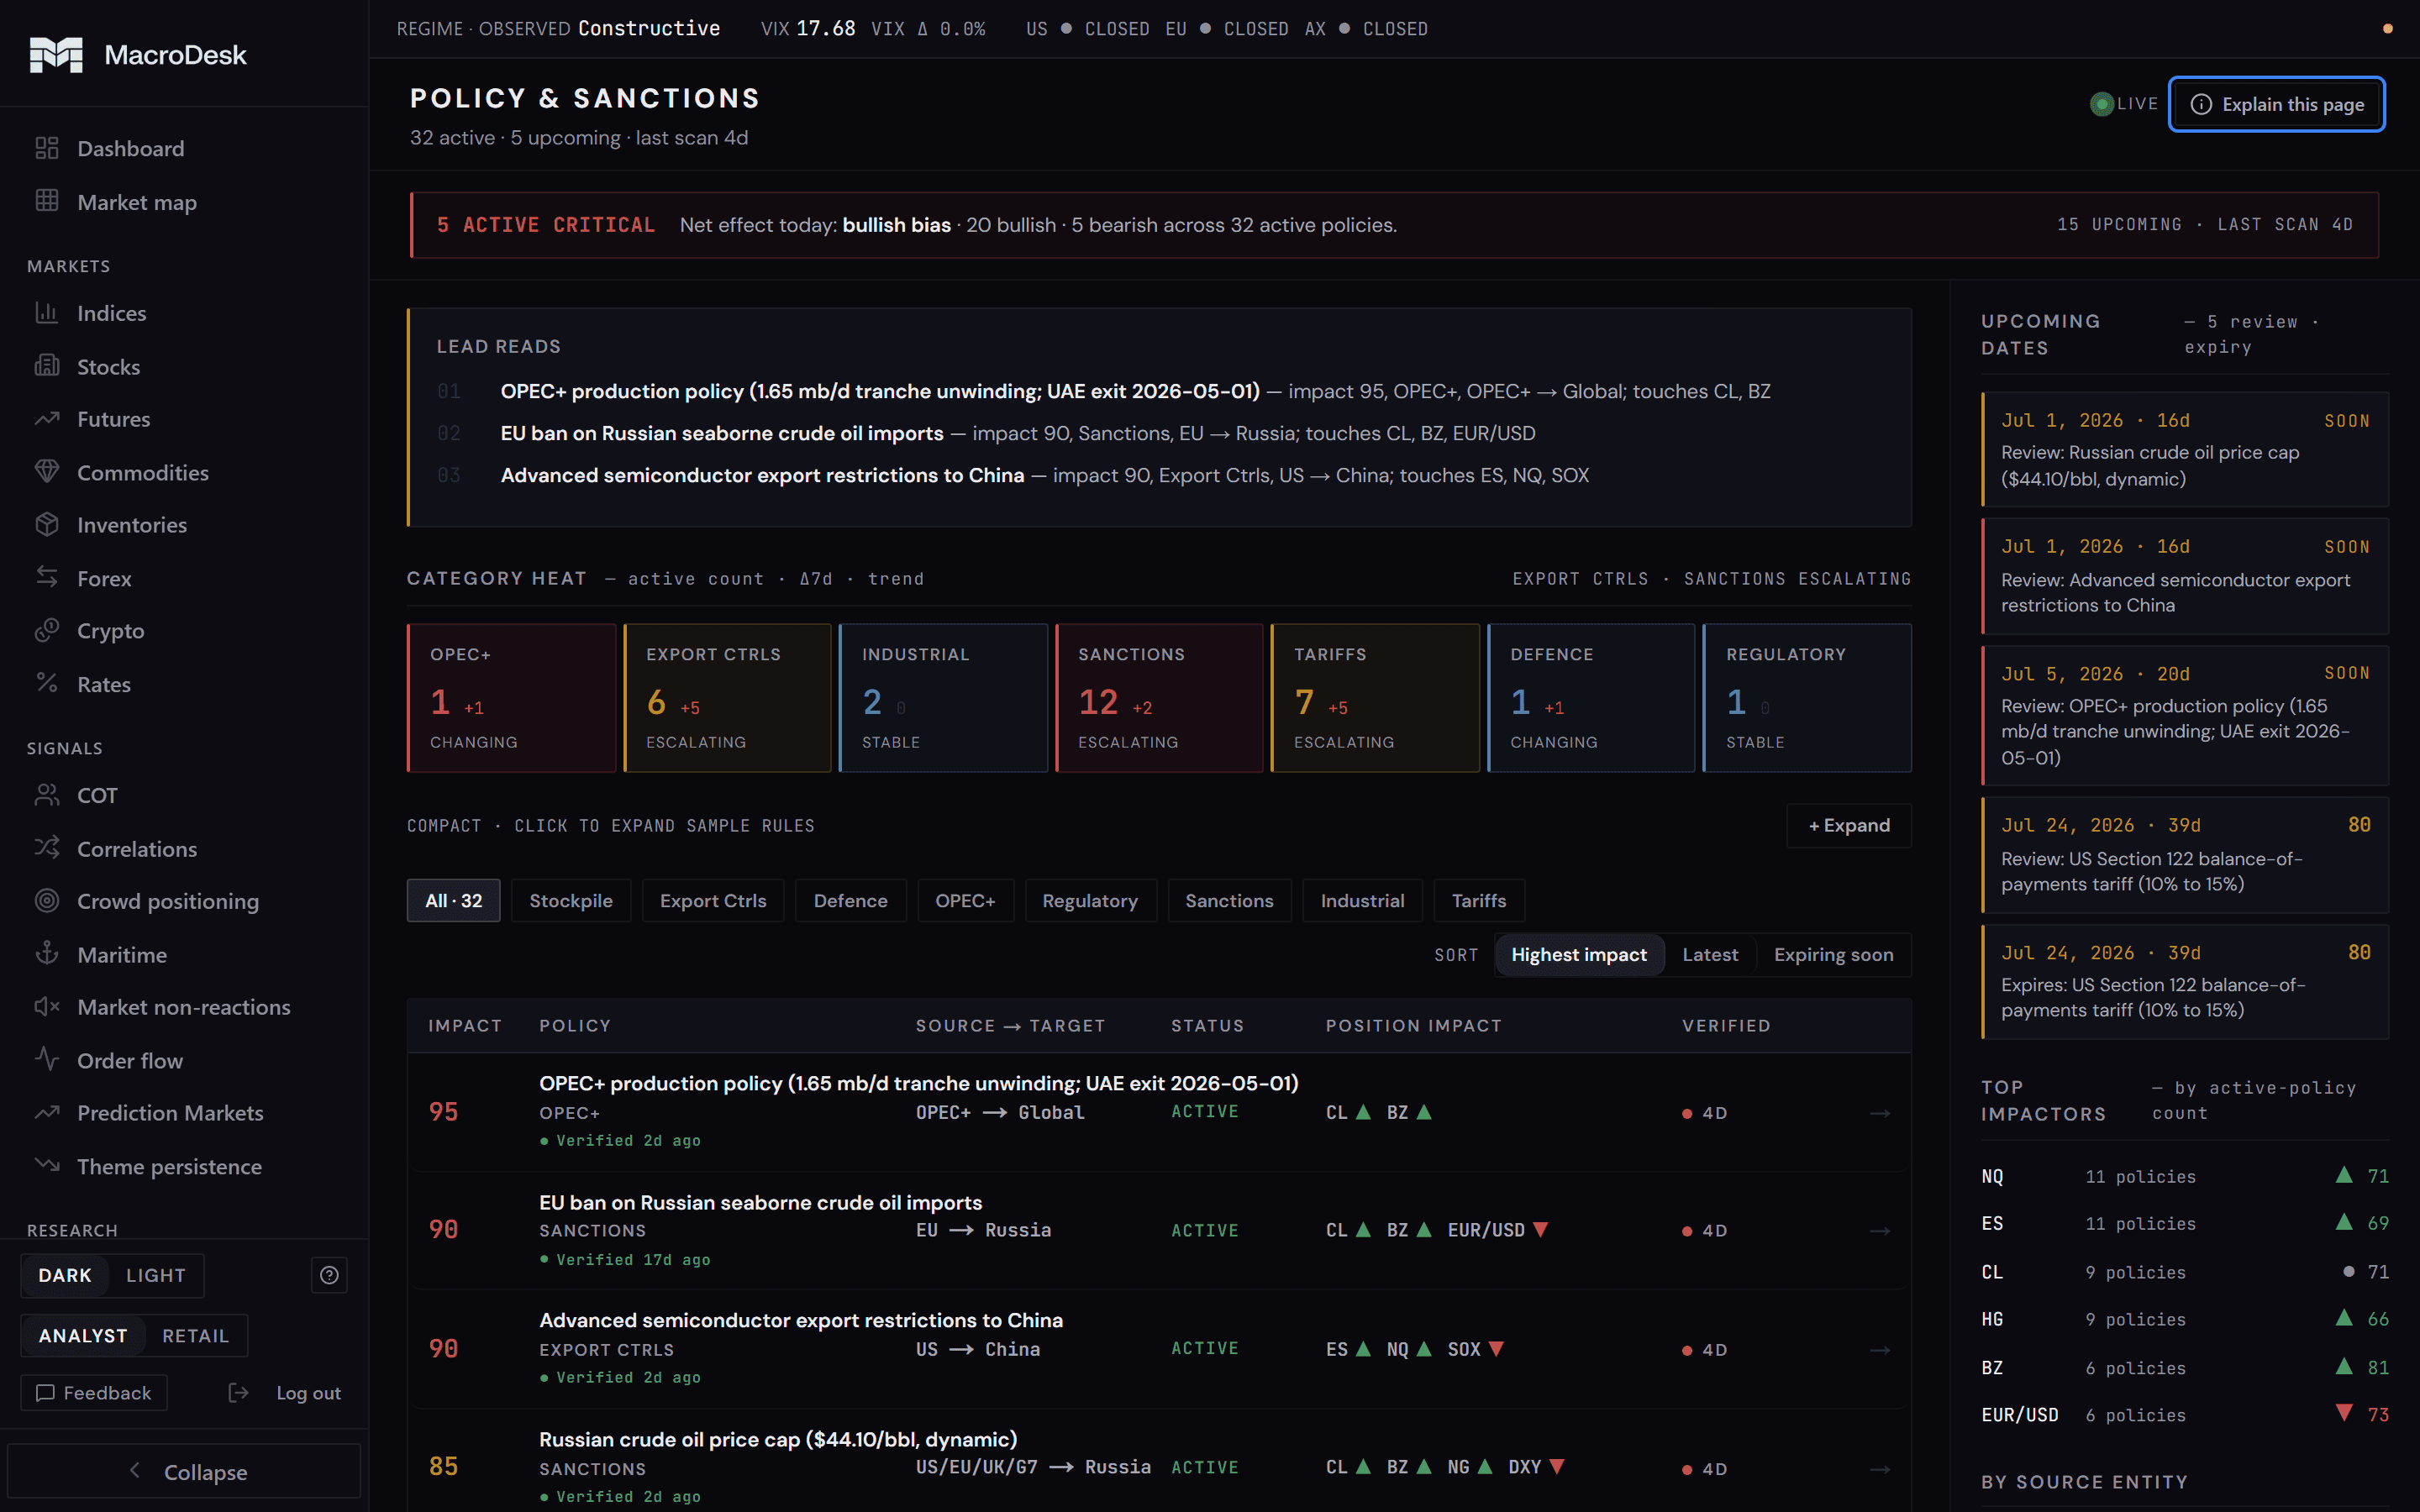
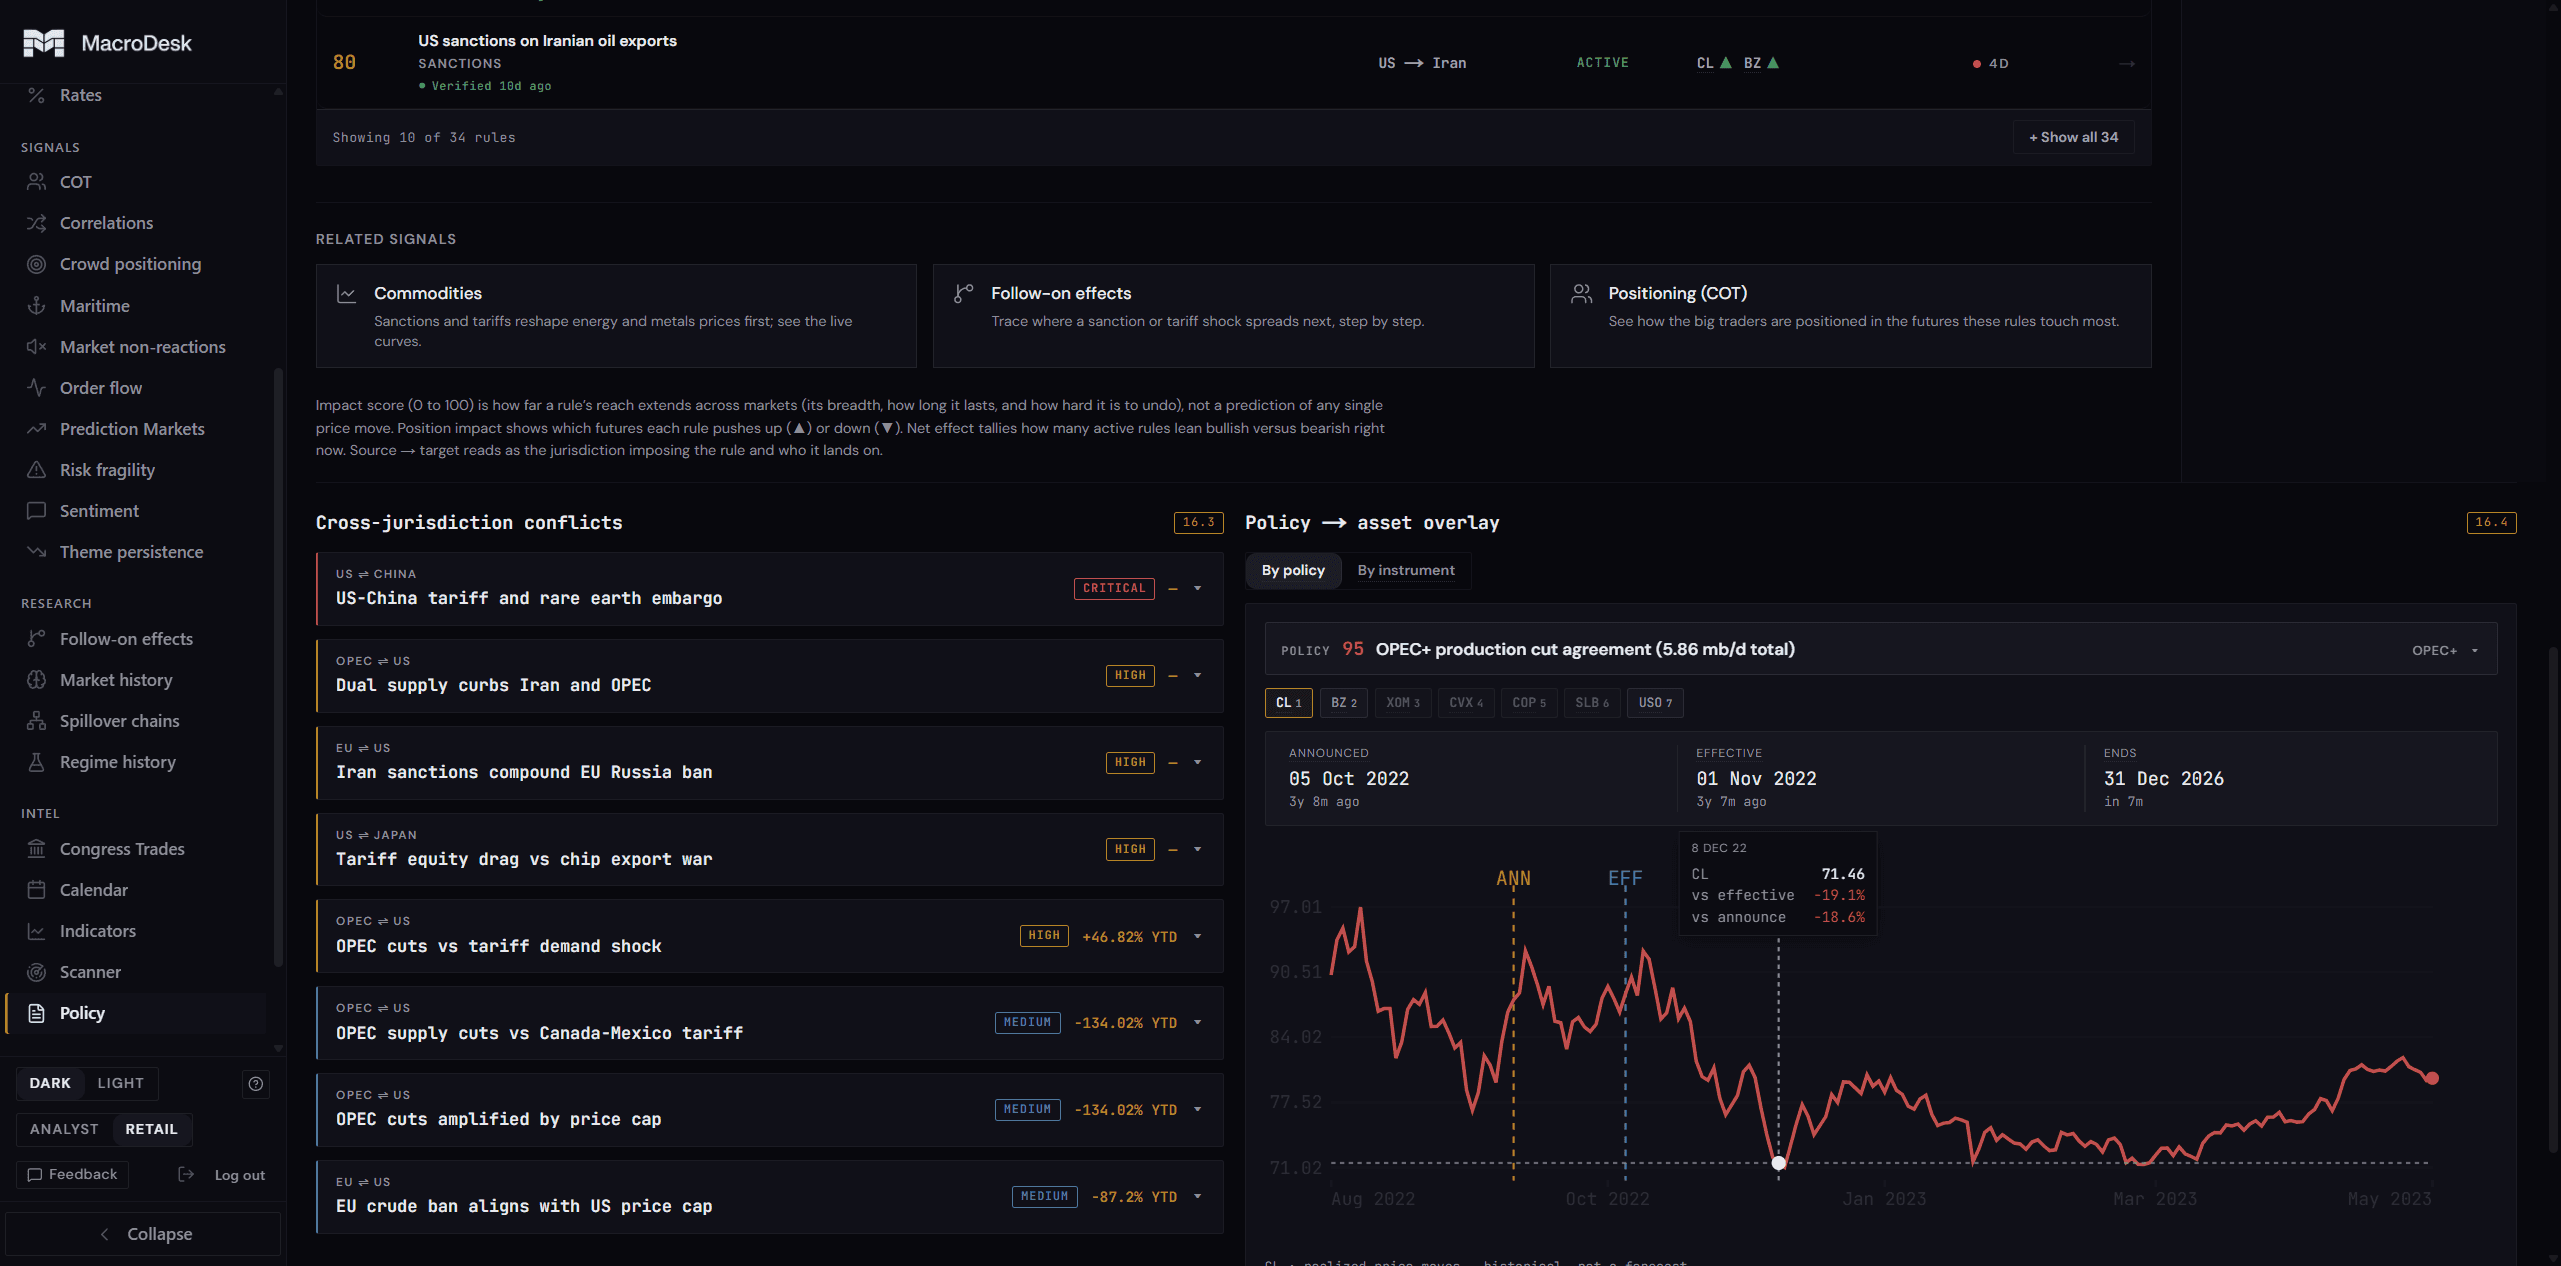
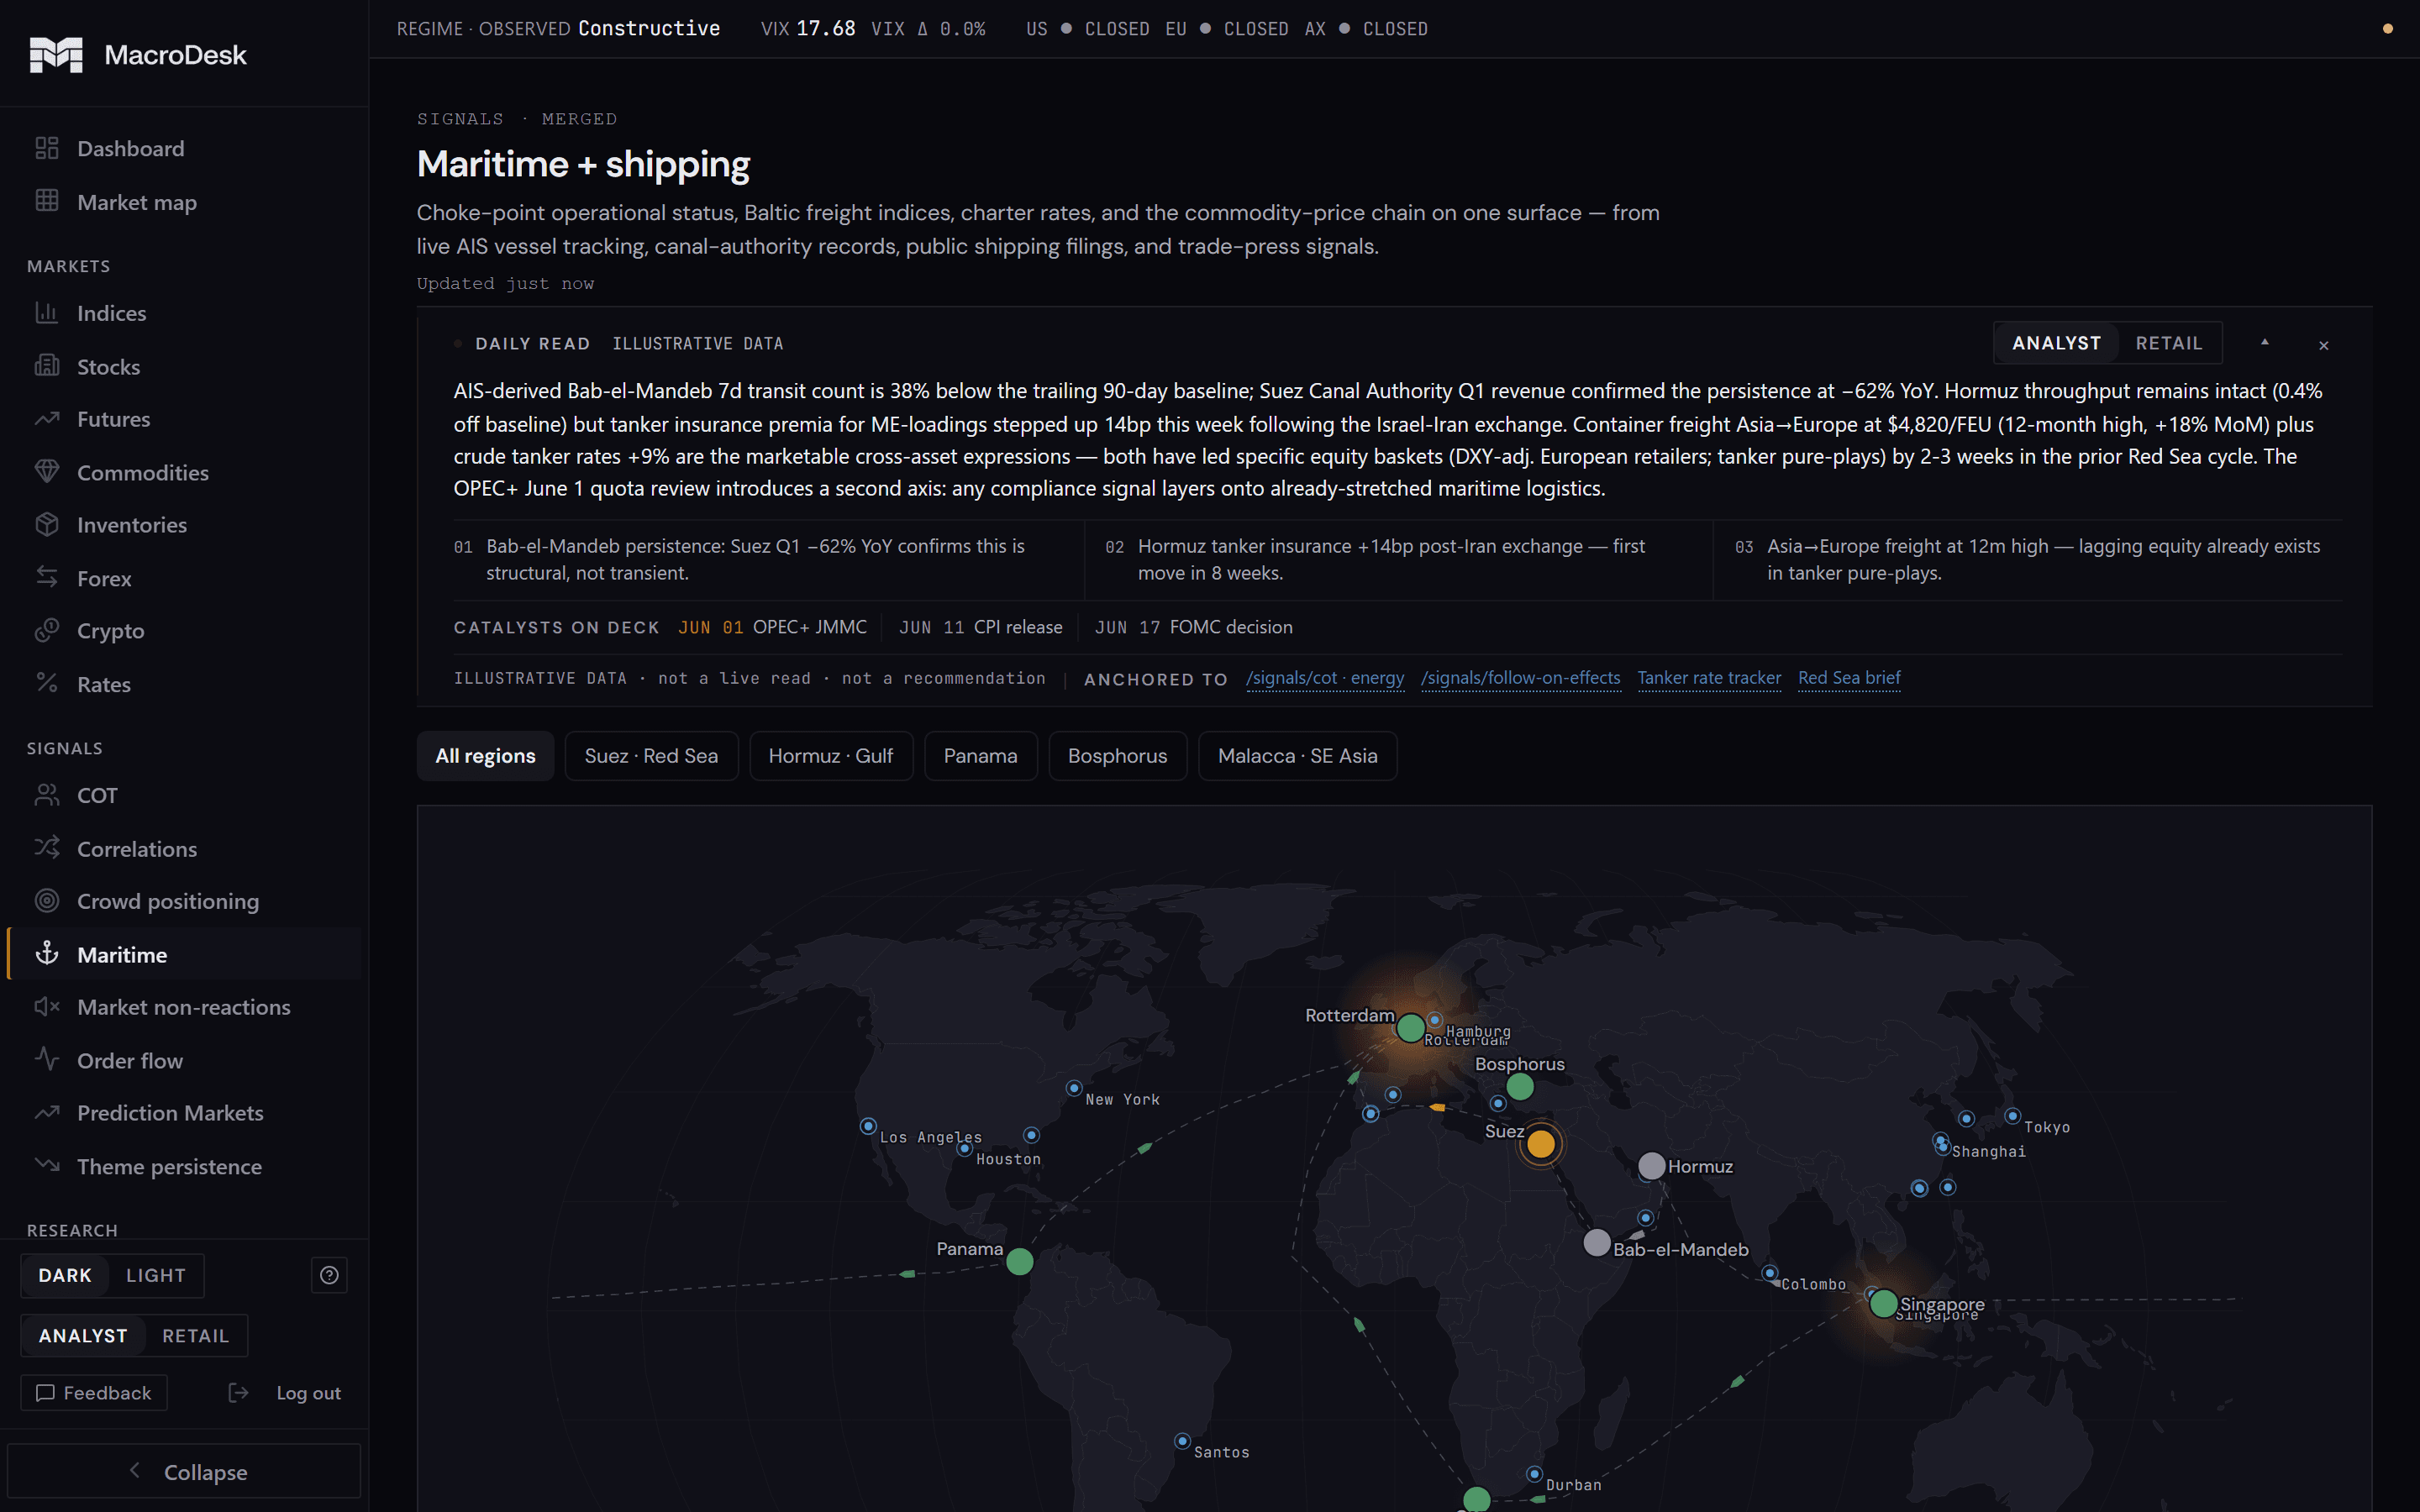
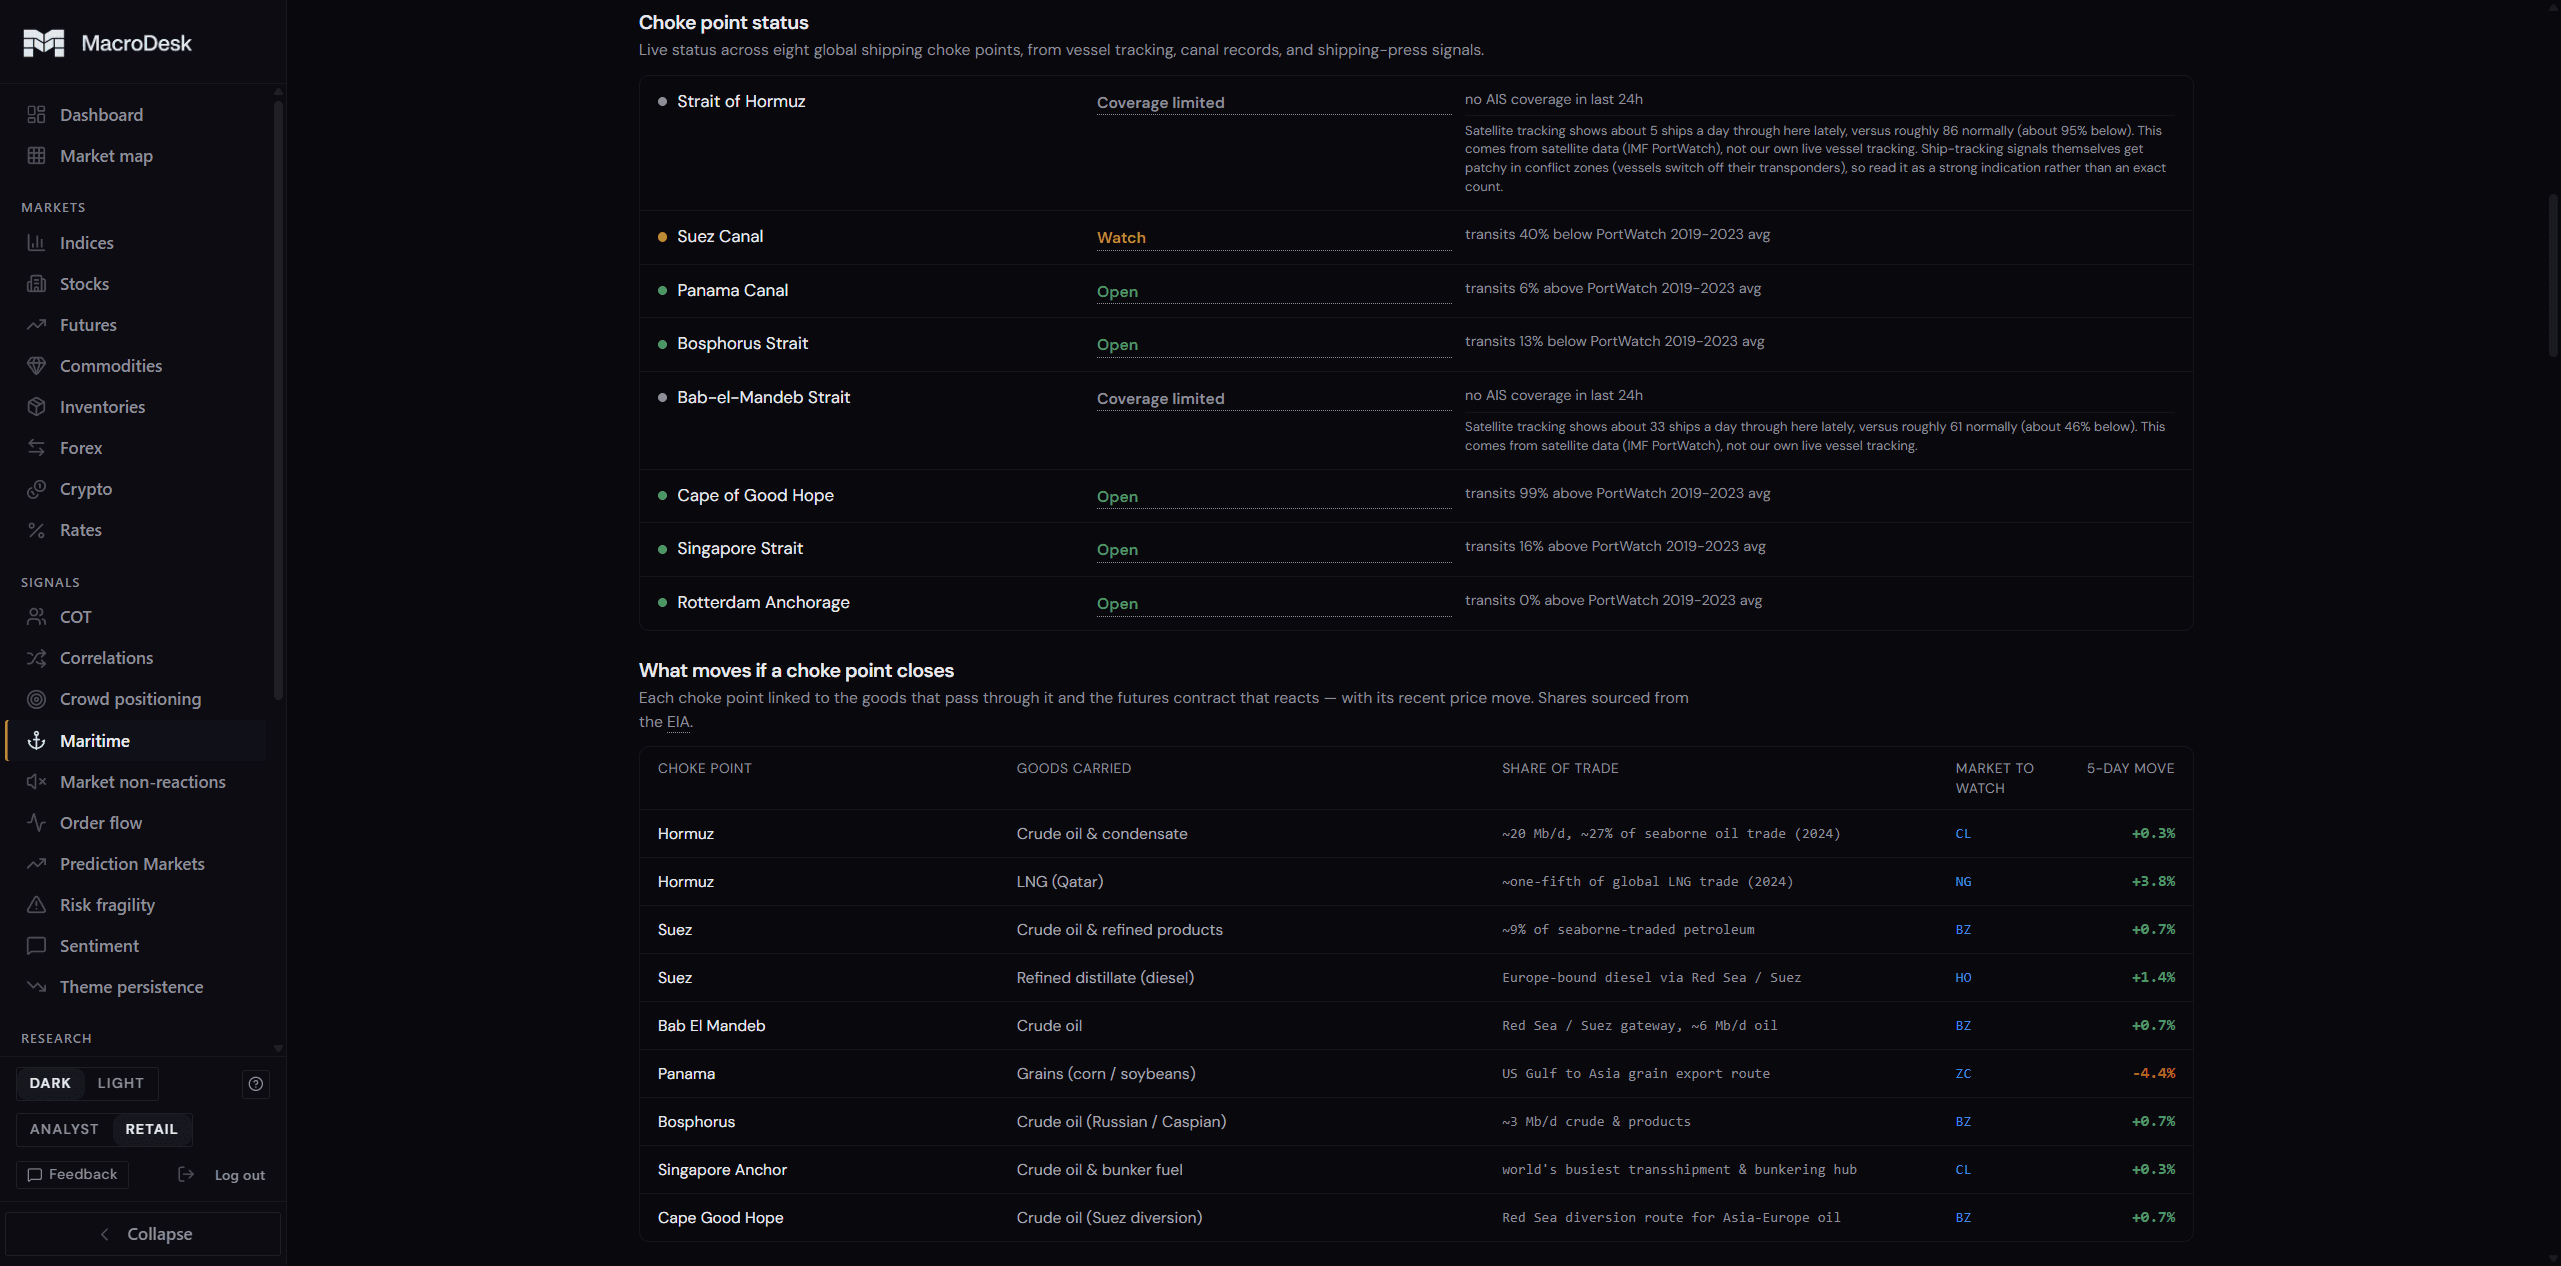
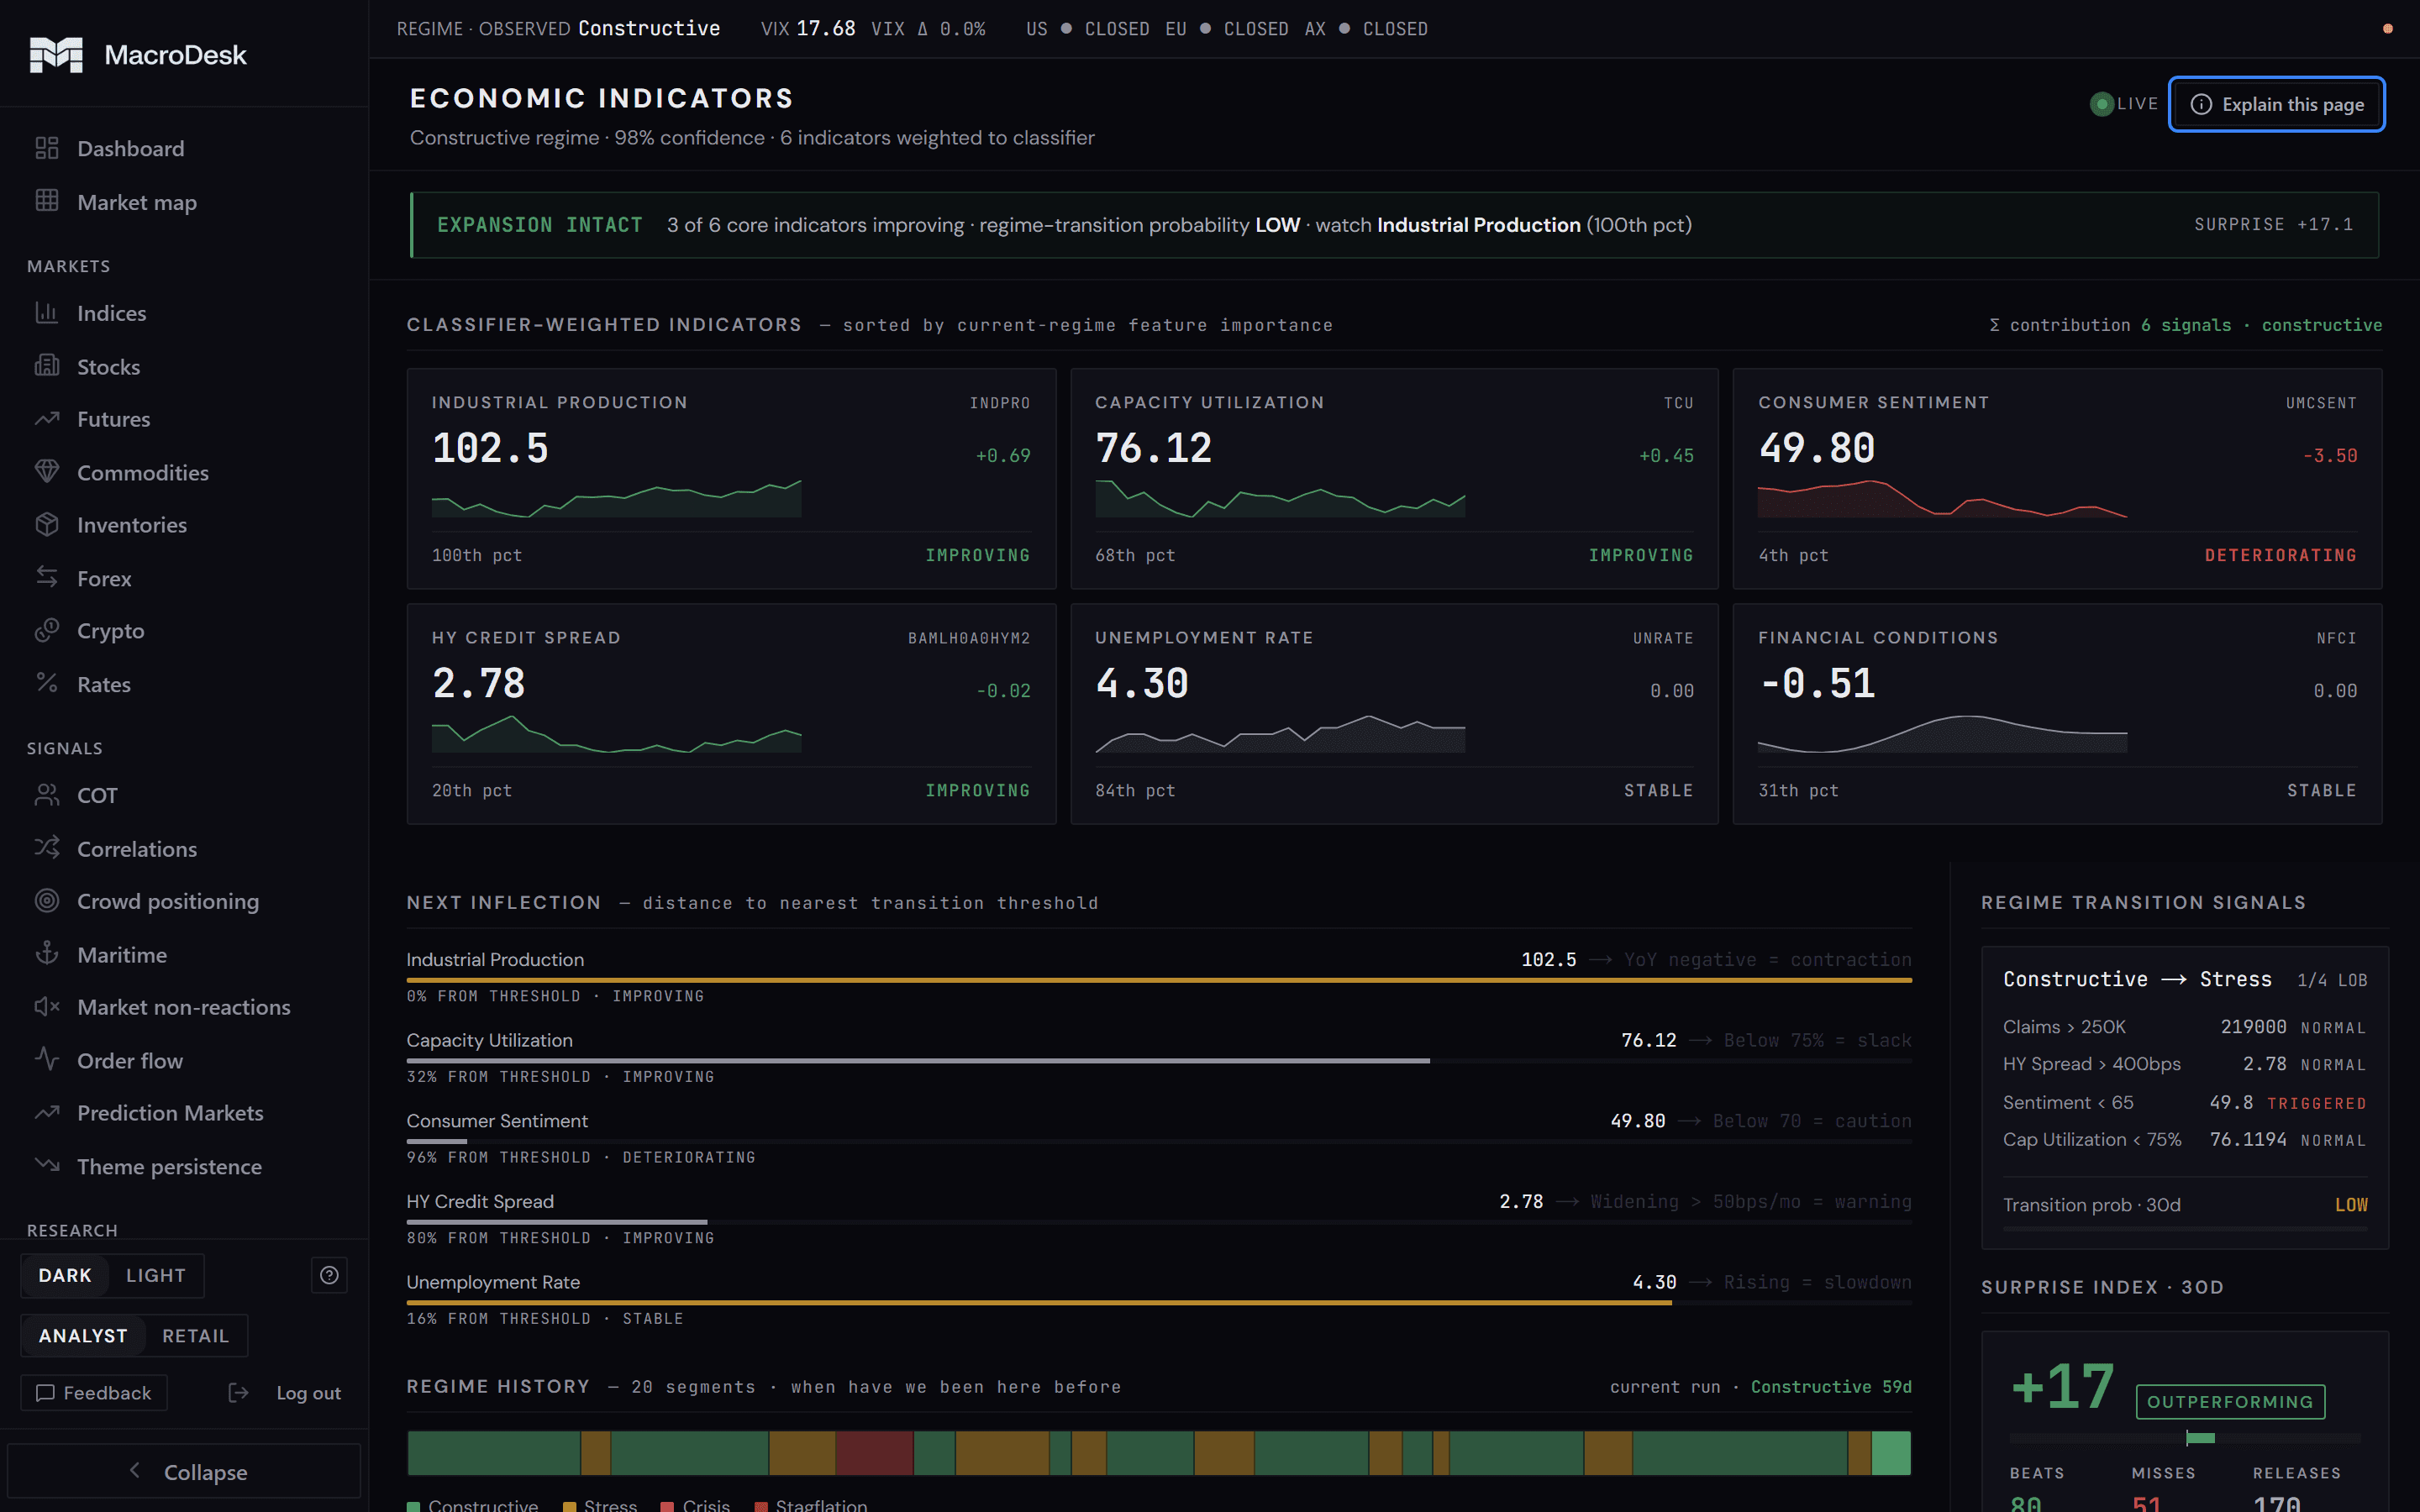
A few real surfaces from the live workstation, each one explained. Some pages show anA few real pages from the live app, each one explained. Some pages show an overview and a detail view; you’ll see both. Every page opens with a plain-English daily read, and an Explain this page button breaks down what every number means. Not exhaustive, just a taste.
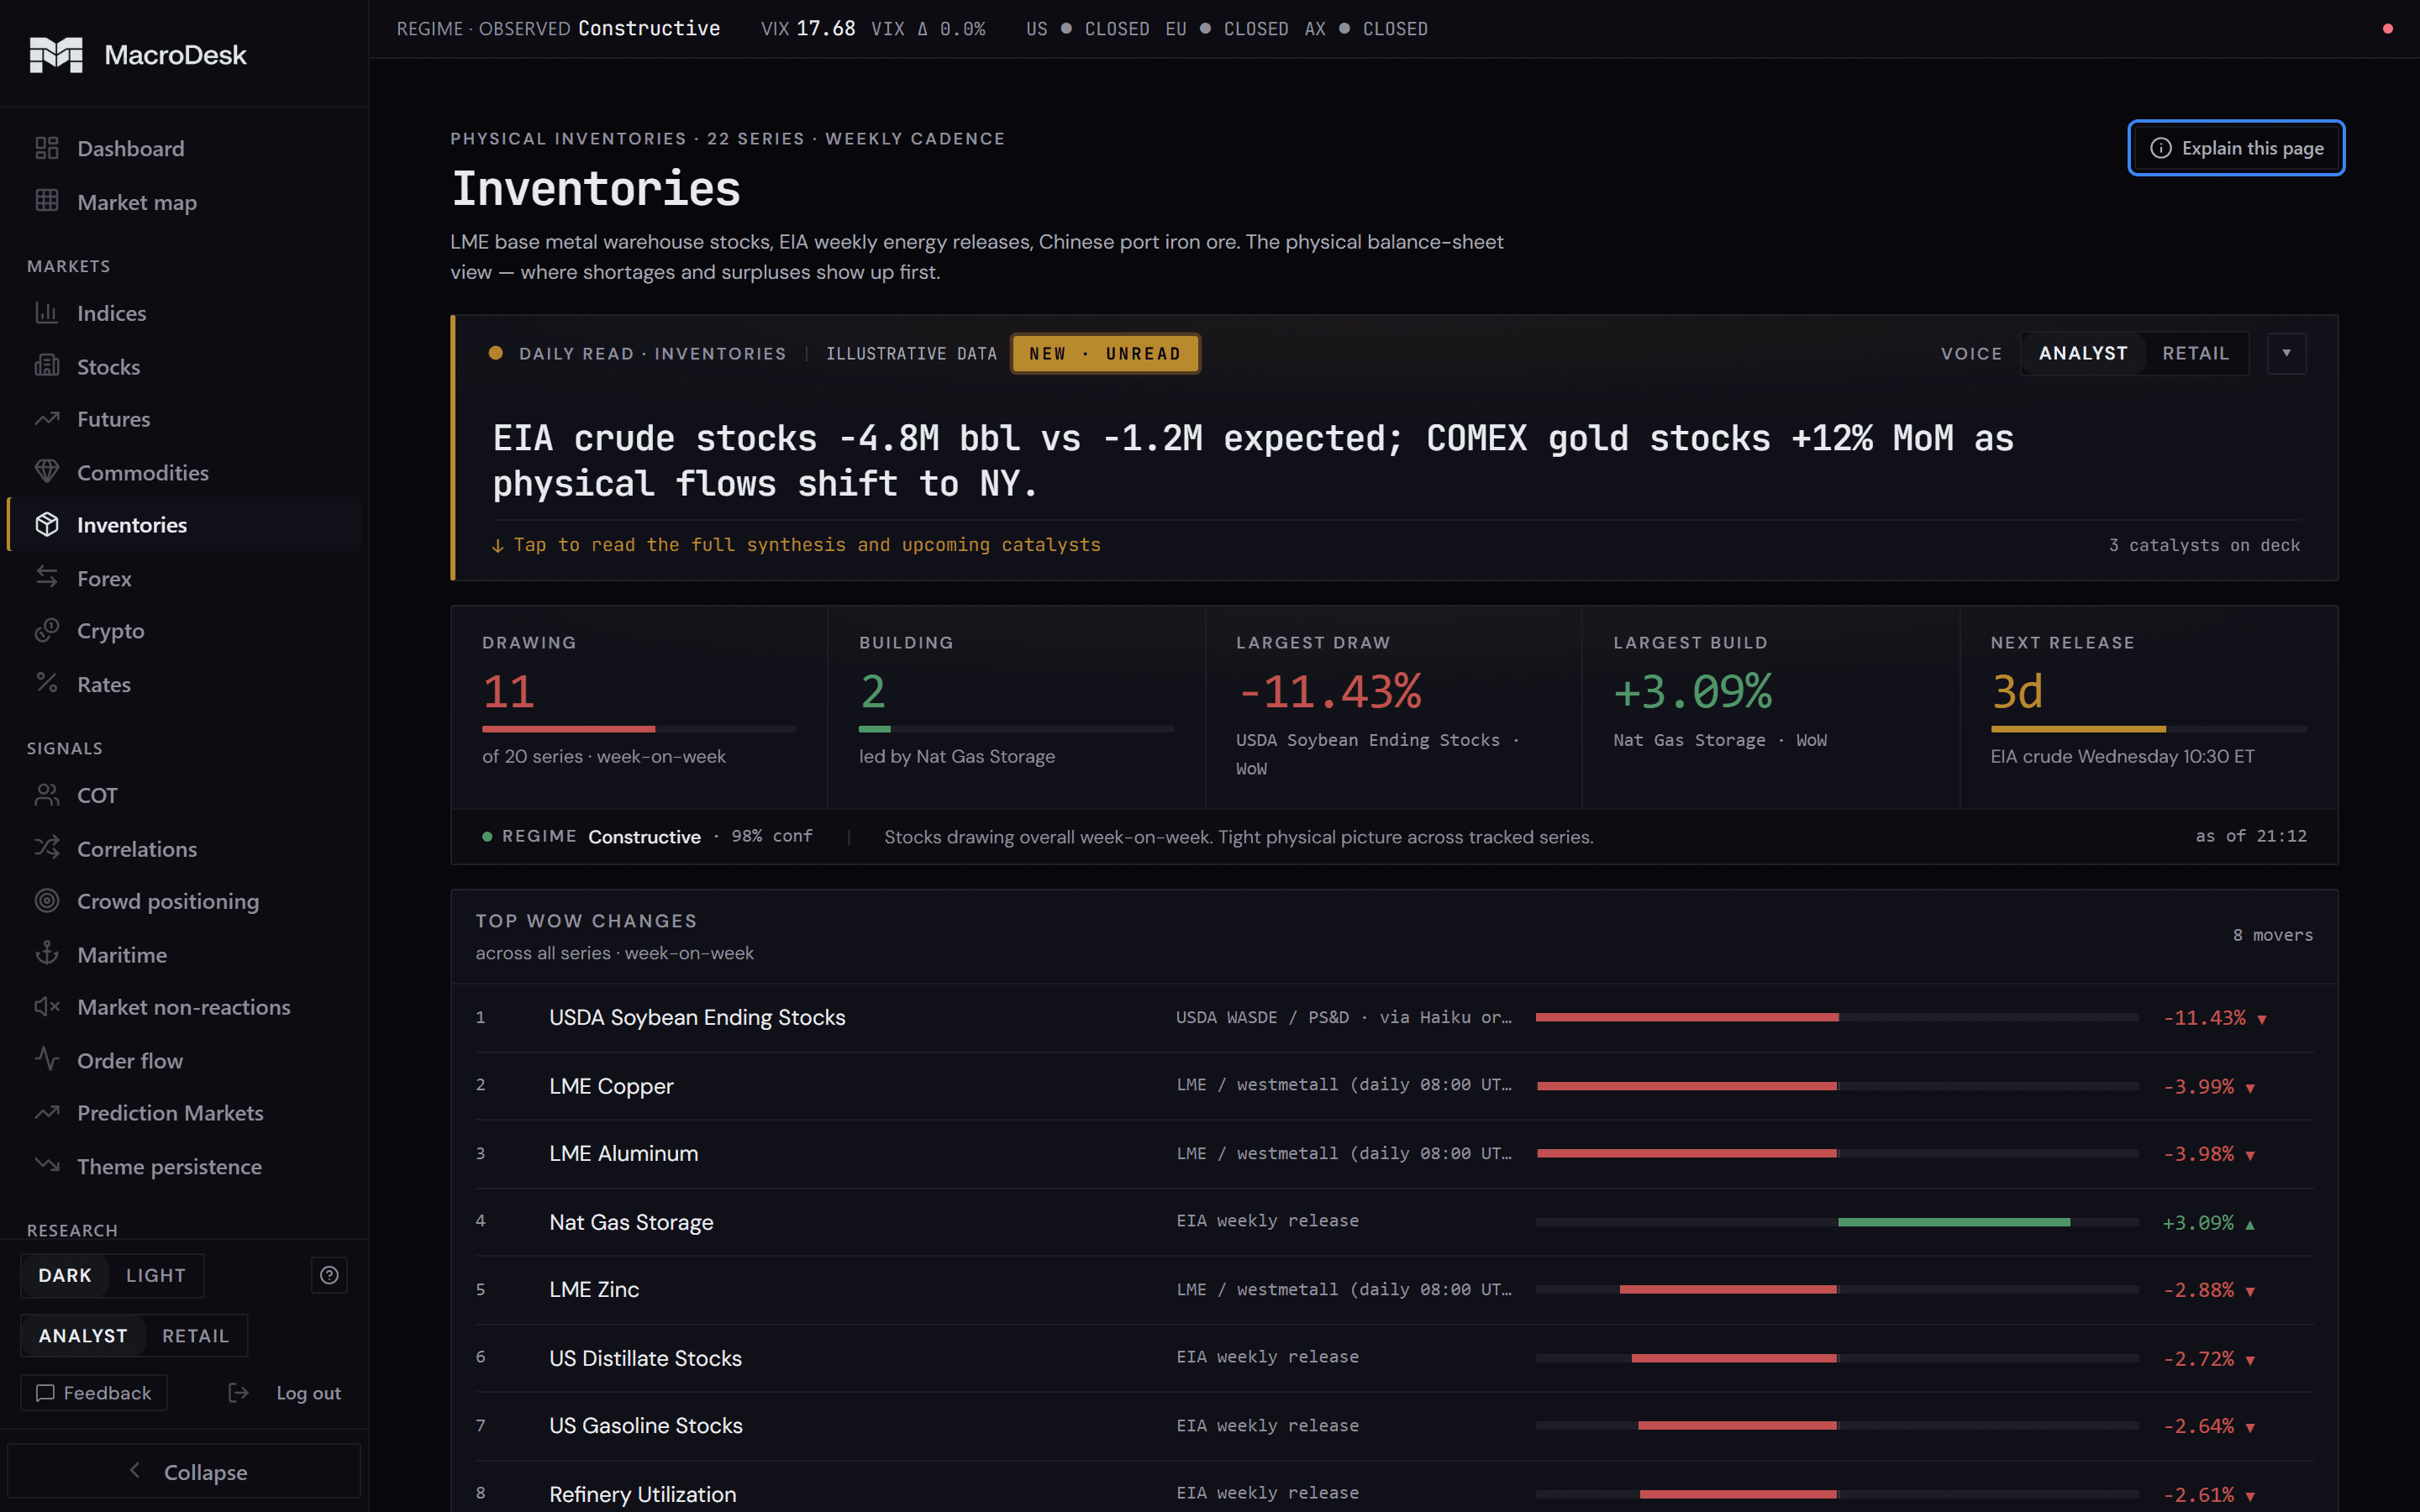
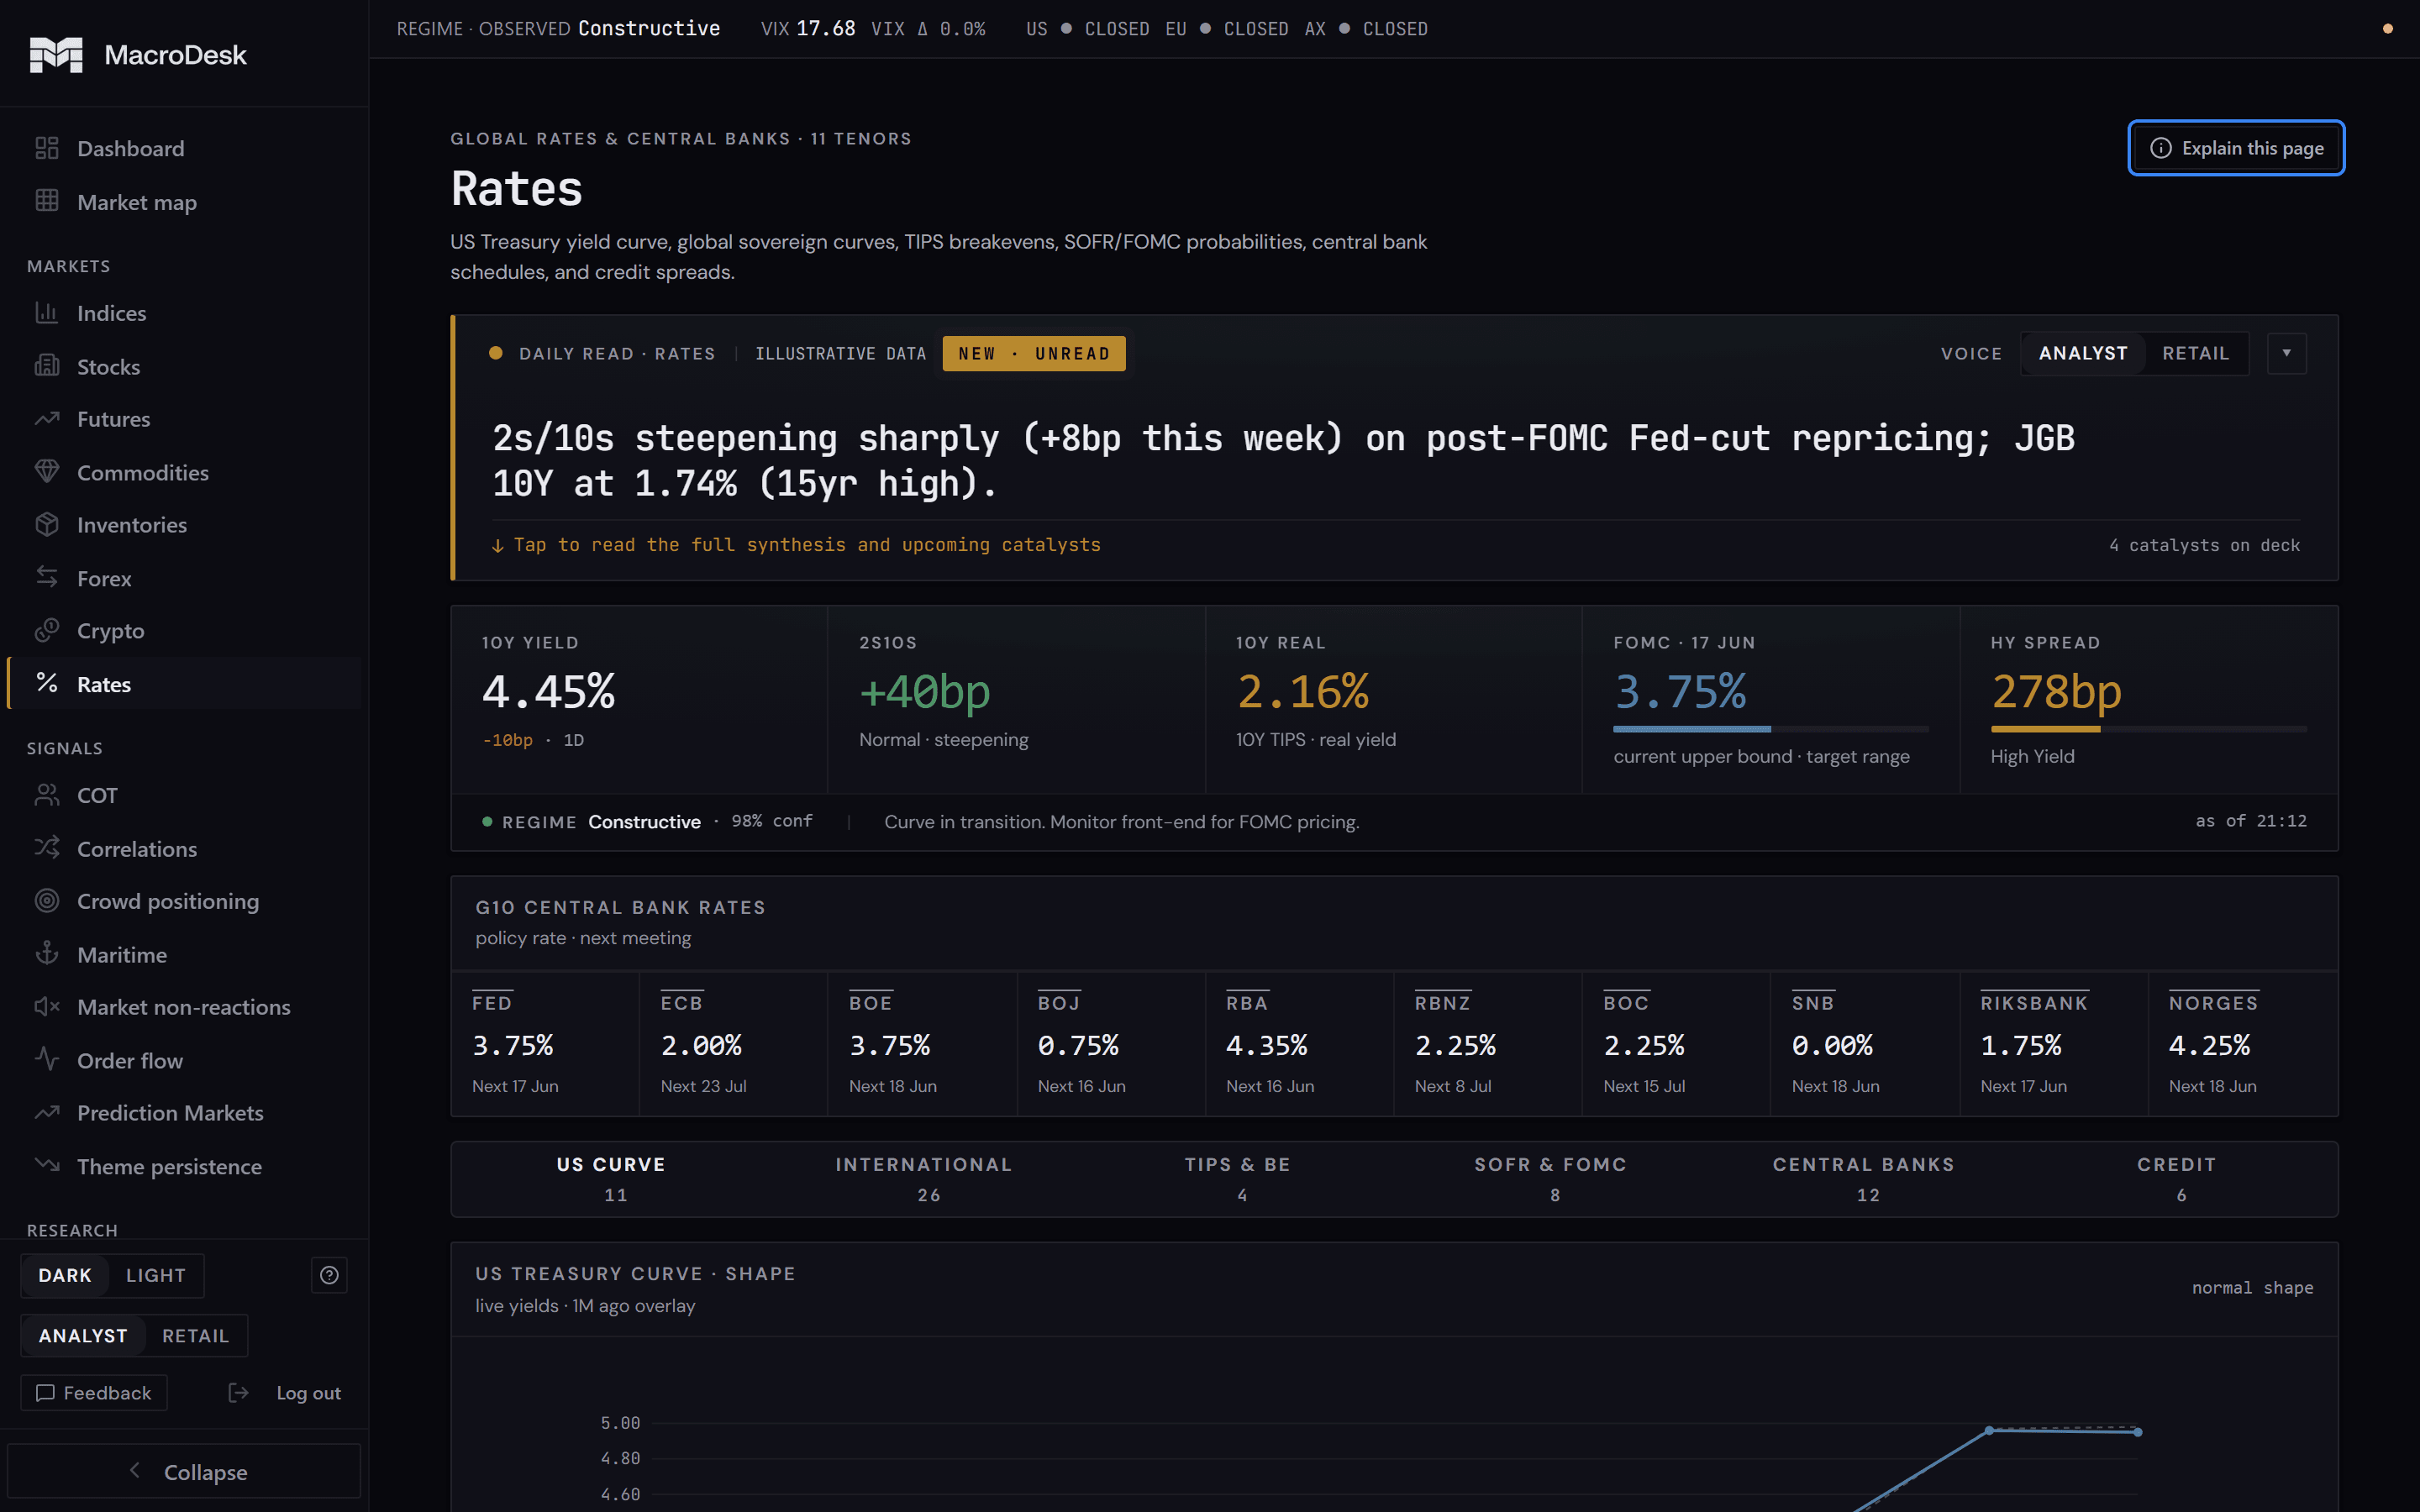
Just a tasteYou’re seeing a brief preview: a handful of 30+ surfaces30+ pages inside MacroDesk. This is not exhaustive, and every page keeps improving.
app.macrodesk.io/inventories
Stockpiles
Interest rates
Policy & Sanctions: overview
Policy: which markets each rule moves
Shipping and sea lanes: overview
Shipping: chokepoint detail
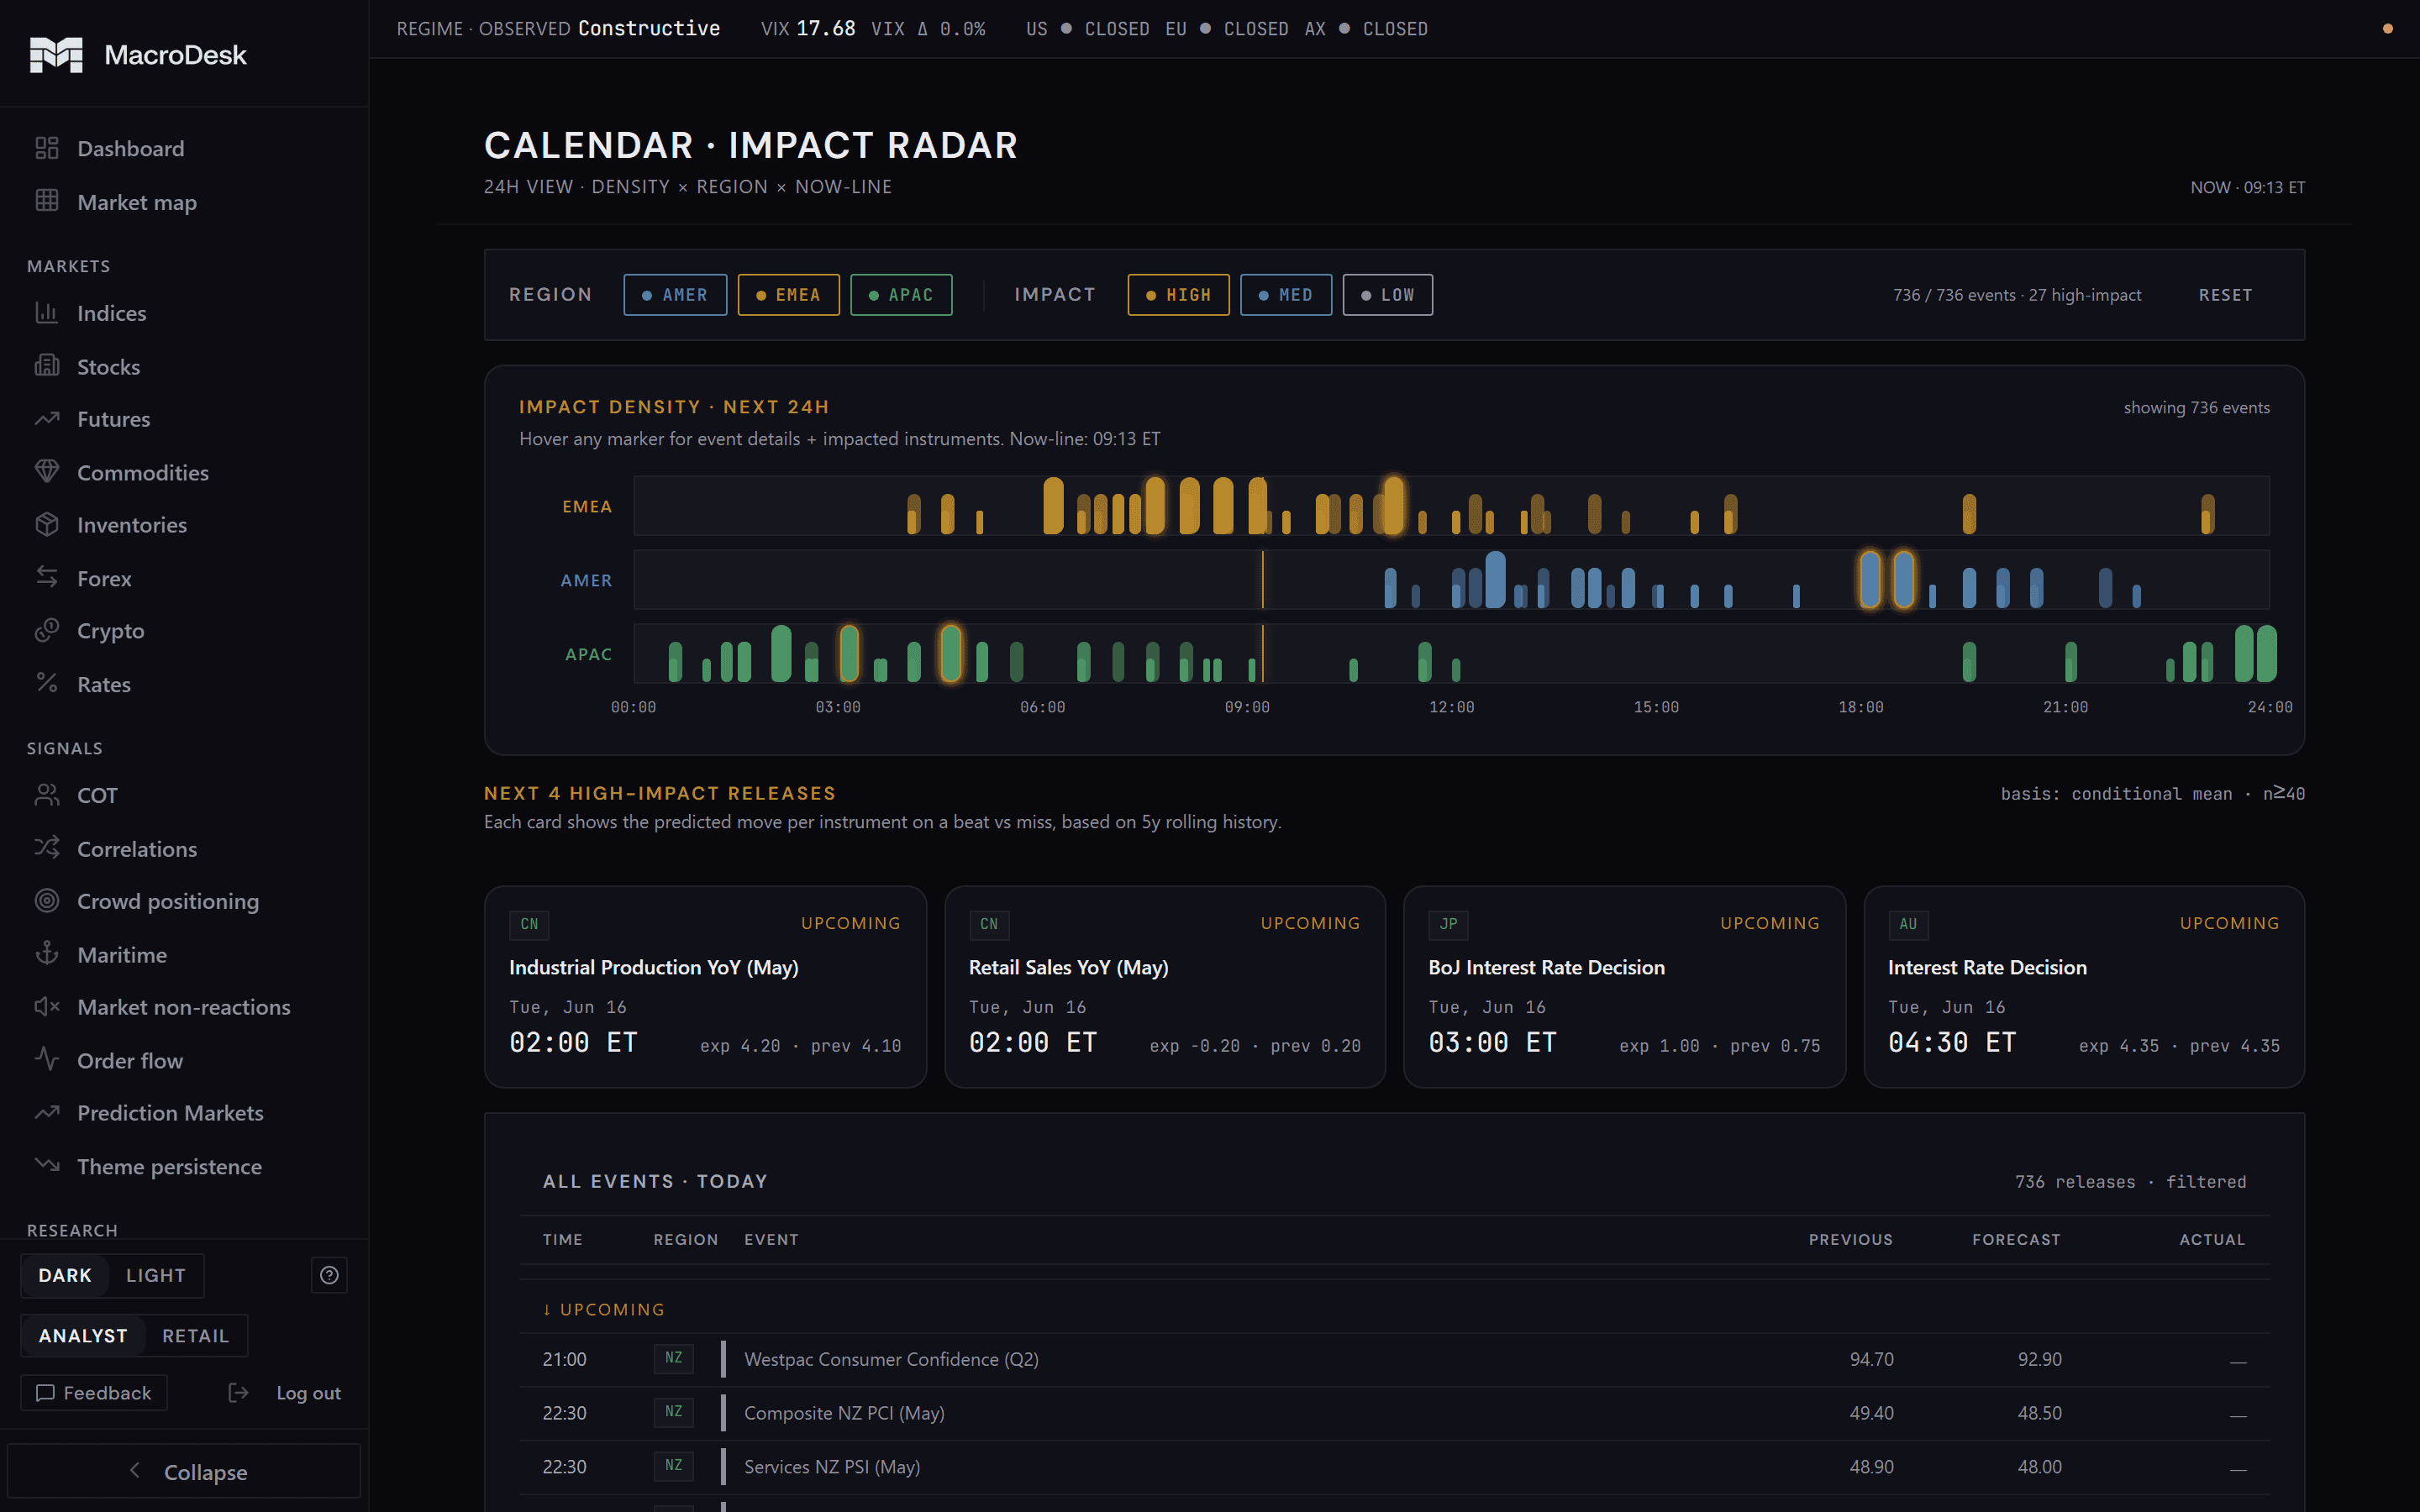
Calendar impact radar
Economic data
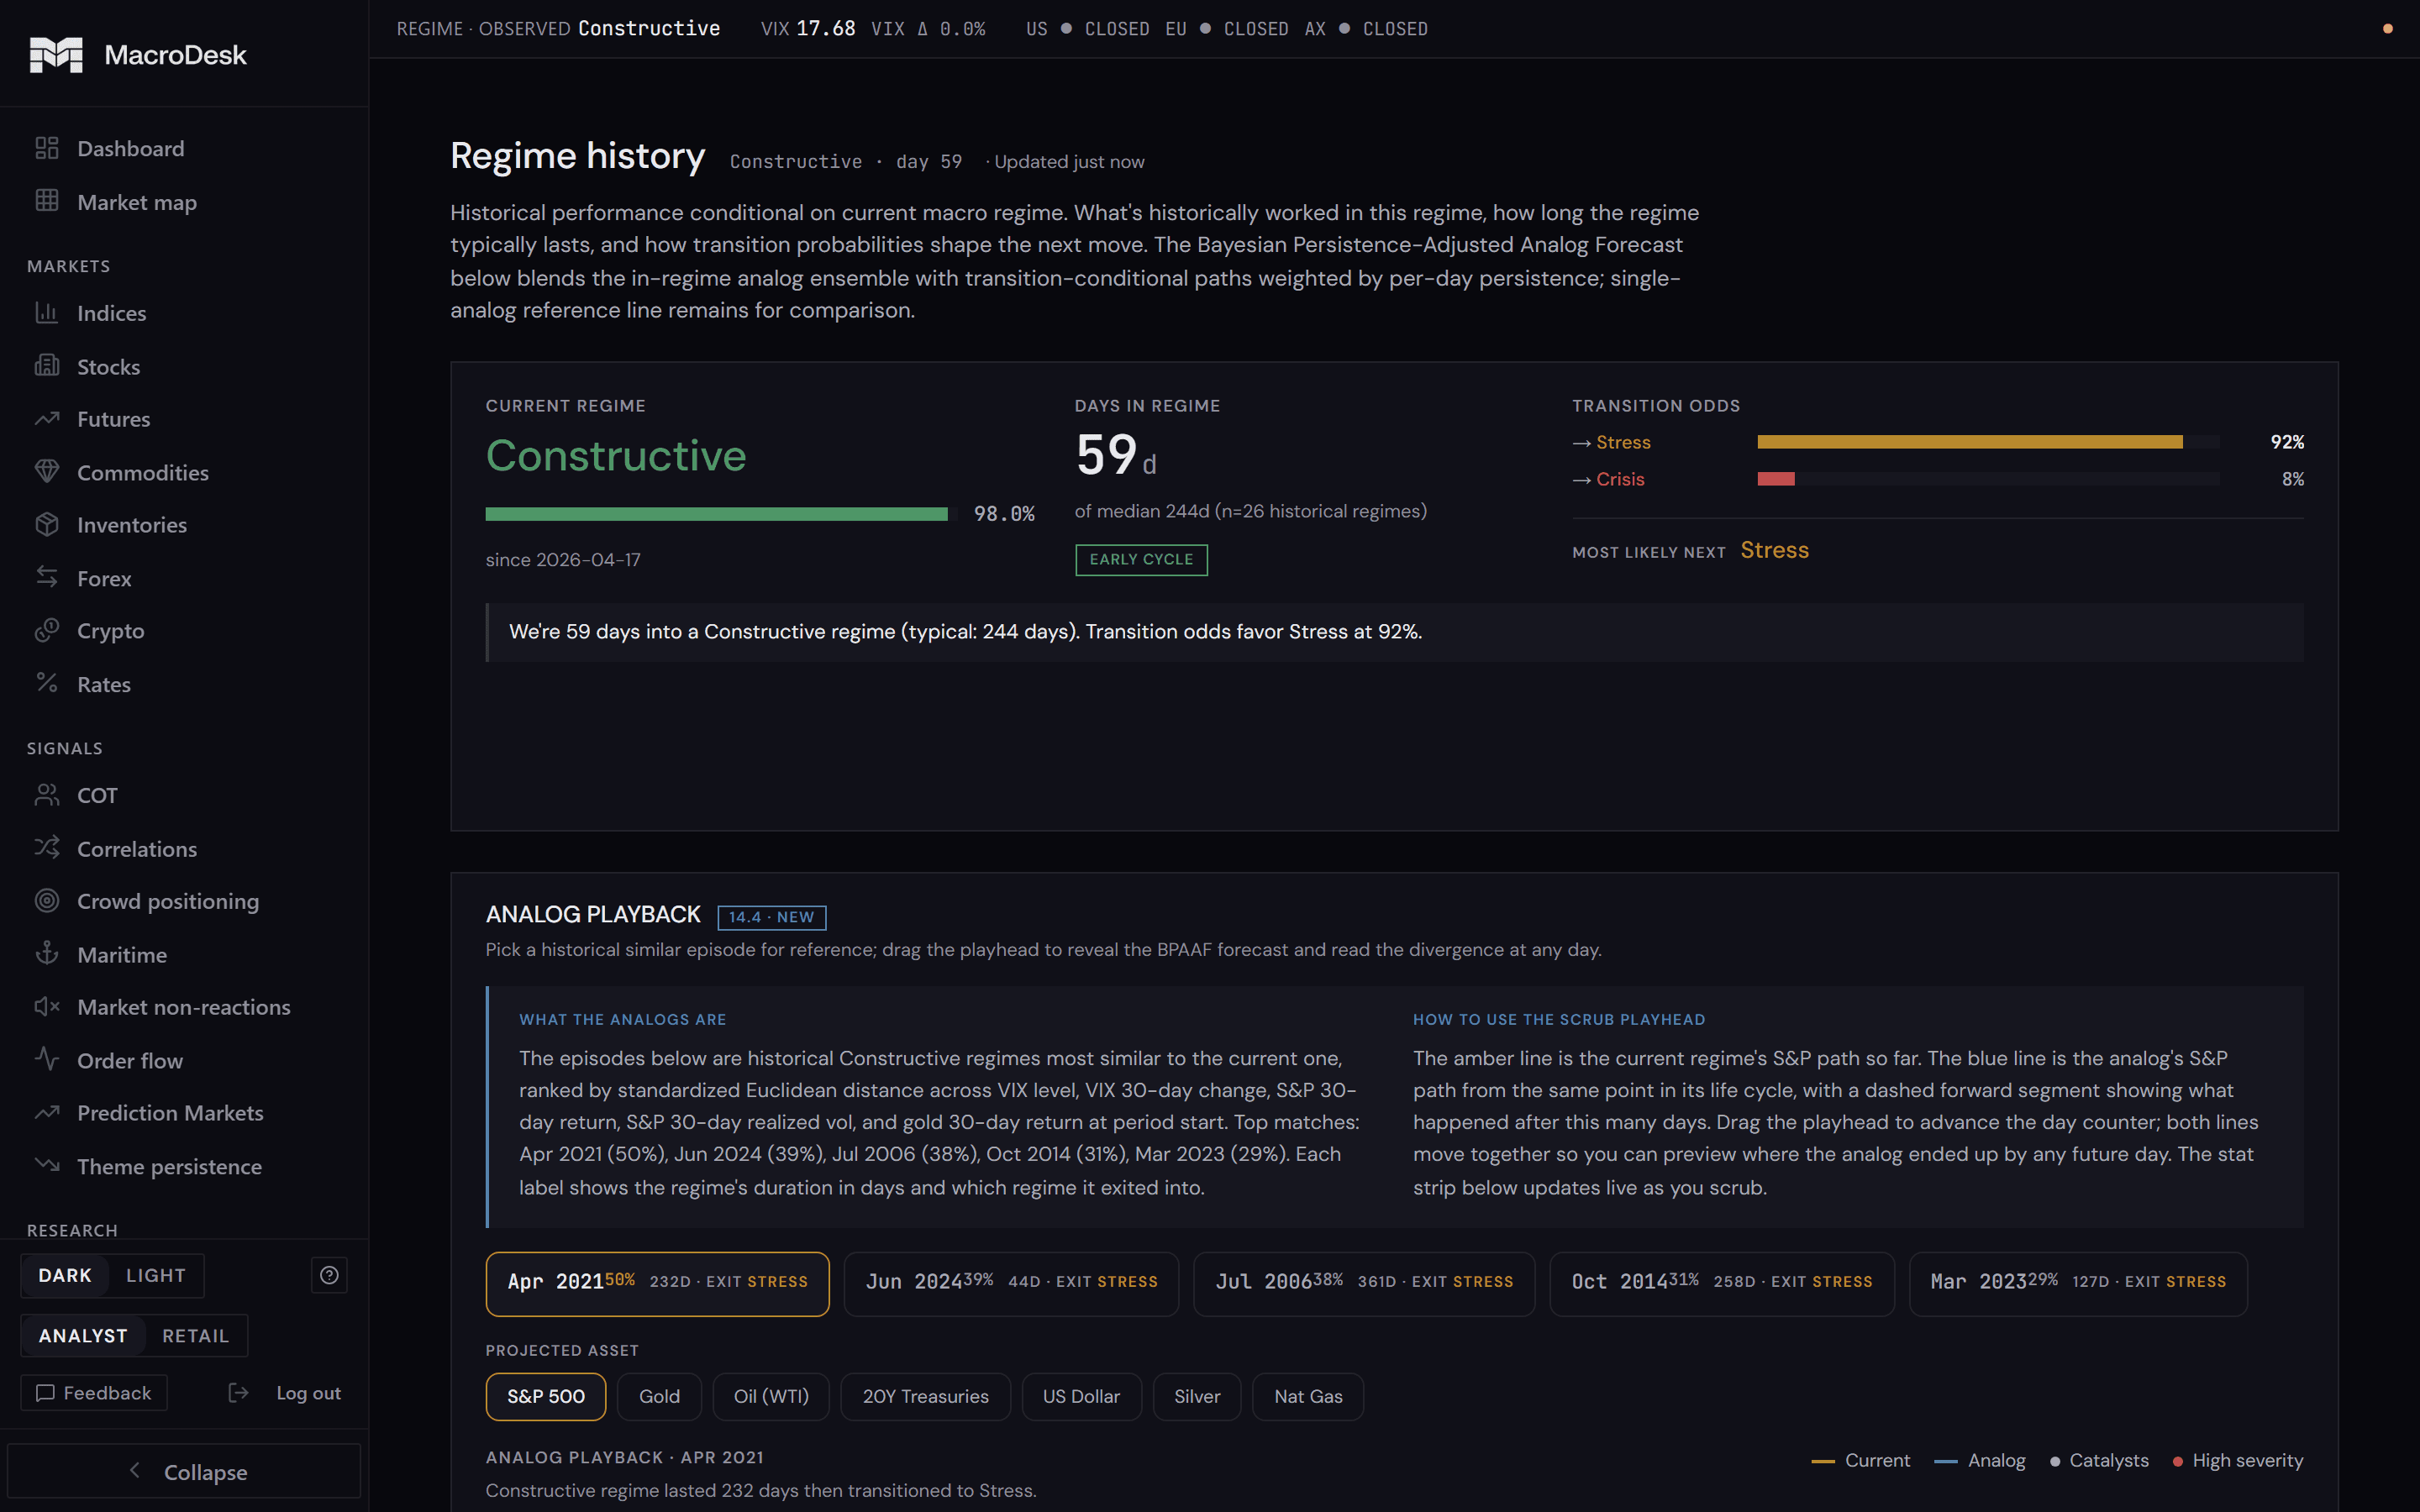
Market regime history: replaying past look-alikes
Explain this page · Inventories · Stockpiles
Weekly physical stock levels for the commodities that trade on supply — crude, products, natural gas, grains. A shortage or a glut shows up here as a number, week by week, with its source. It's the physical side of the market a price chart alone won't show you.Weekly physical stock levels for the commodities that trade on supply: crude oil, fuels, natural gas, grains. A shortage or a glut shows up here as a number, week by week, with its source. It's the physical side of the market a price chart alone won't show you.
app.macrodesk.io/inventories
tap to close
InventoriesStockpiles
Weekly physical stock levels: where a shortage or a glut shows up as a number, week by week.
a taste · not exhaustive · not live data
app.macrodesk.ioTHE DESK IN MOTION
The same surfaces in one continuous take — the dashboard, the live scanner, the policy board and the market map.The same pages in one continuous take: the dashboard, the live scanner, the policy board and the market map. Click to play.
ⓘ
Never stuck on a number. Every page ships with its own explainer. Tap Explain this page for a guided, plain-English walkthrough of what you’re looking at and why it matters.
How it works · what it does

One surface that displays the marketOne screen that shows the market and interprets it.and explains it.

Components are commodities. The point is they finally sit in one place and talk to each other. Here’s the path from a raw filing to a counted line — and what the desk does with it.The separate tools are easy to find. The point is they finally sit in one place and talk to each other. Here’s the path from a raw announcement to a counted line, and what the desk does with it.

01 · IN

It reads the event

Every announcement comes in, gets recognised for what it is, and the facts that matter get pulled out, the way a desk analyst triages it.Every announcement comes in, gets recognised for what it is, and the facts that matter get pulled out, the way a professional analyst would sort it.

02 · WEIGH

It counts what came before

Each filing is matched with similar past filings, and the scanner counts how many were followed by a sharp move: n, the dates and the source of each.Each announcement is matched with similar past ones, and the scanner counts how many were followed by a big price move: how many, when, and where each came from.

03 · OUT

It shows the line, and the count behind it

You get a descriptive line with its count, its dates and the macro context around it, in analyst language or plain English. No forecast, no direction. You decide what to do with it.You get a plain line with how often, when, and the economic picture around it, in analyst language or plain English. No prediction, no direction. You decide what to do with it.

01

Reads every filing

Company announcements on the ASX, each matched with similar past filings and counted, instead of a headline you decode yourself.Company announcements on the ASX, each matched with similar past ones and counted, instead of a headline you decode yourself.

02

Macro context, always attachedThe big picture, always attached

Rates, central banks, the calendar, policy and positioning sit beside every filing, from public sources. Nothing is read in a vacuum.Interest rates, central banks, the calendar, policy and positioning sit beside every announcement, from public sources. Nothing is read in a vacuum.

03

All your tools in one place

Filings, macro data and policy, consolidated where they finally talk to each other.Announcements, economic data and policy, brought together where they finally talk to each other.

04

Two voices, one read

A hand-made language layer flips every page between analyst and plain English. Same intelligence, your choice of voice.

↓ flip the whole desk in the next section
The language system

One read. Two languages.

Every number, signal and brief is written twice: the shorthand a desk analyst skims, and plain English anyone can act on. Same facts, same rigour. Flip the toggle on any card — the whole desk follows, like the scanner card up the page.Every number, signal and brief is written twice: the shorthand a professional analyst skims, and plain English anyone can act on. Same facts, same rigour. Flip the toggle on any card and the whole desk follows, like the scanner card up the page.

app.macrodesk.io/dashboardANALYST ⇄ RETAIL
One toggle rewrites the live desk —One toggle rewrites the live desk: “Constructive” becomes “Risk-on,” and every label and note follows. Recorded on the real dashboard.
app.macrodesk.io/dashboardDESK BRIEF · FULL READ
The desk brief opens to the full read, then the same toggle rewrites it in plain English — the reasoning, not just the call. Recorded on the real dashboard., then the same toggle rewrites it in plain English: the reasoning, not just the call. Recorded on the real dashboard.
CPI · hot printInflation · hot reading
AnalystCore above consensus; front-end yields repriced higher inside the first minute.
RetailInflation came in above forecasts, and short-term bond yields rose within the first minute.
Regime
AnalystConstructive, 99% conf — conditions loose, breadth firm, vol bid into the print.
RetailThe market backdrop is healthy and steady, with most stocks taking part, though traders are paying up for a little protection before the data.
Order flowUnusual trading
AnalystHeavy institutional flow — avg RVOL 1.9×, 8 of 10 core contracts off pace.
RetailBig institutions are trading well above their usual pace today: 8 of 10 core contracts are ahead of their normal volume.

It’s on every surfaceevery page, plus an Explain this page button that breaks down each number in the voice you chose. Any unavoidable jargon carries a hover tooltip with a plain-English definition.

Coverage

The ASX’s filings, and the macro around them.

10 areas·2 voices·1 desk
ASX announcementsASX company announcements
Macro today
Central banks
RatesInterest rates
Economic calendar
Economic data
Policy & sanctions
Futures positioning (COT)How futures traders are positioned
Shipping · choke points
Stockpiles
No black box

Show the reasoning, not just the verdict.

A signals service hands you a buy or a sell and nothing else. MacroDesk hands you the reasoning, and lets you make the call. We don’t promise win rates; we give you the full picture and trust you to use it.

  • →
    Every read shows its workingEvery read shows its reasoningWhat each line rests on, and the context around it. Not a number with no story behind it.
  • →
    How much history stands behind itHow much history is behind itEach line carries its count and its dates, so you can see how thin or deep the record is.
  • →
    A guide, not a directiveA guide, not an orderAn input to your decision, wrapped in everything behind it. You stay in the driver’s seat.
From the founder

I spent years trading the ASX, mostly mining names, and a few years back that turned into an investing group with some mates. Along the way I’d run through every major trading platform out there, and not one of them did the thing I actually needed: take all the data and tell me what it meant, in one place, fast enough to act on. So I started building it myself, and that became MacroDesk. I still trade every week and I’m about as obsessed with this space as it gets. This is the desk I always wanted on my own screen.

AB
Andrew Ball
Founder · Perth, WA
Replace your stack

Your stack has seven tools and no answer.

Every one of them shows you something. None tells you what it means. Here’s the stack side by side against one surface that does the assembling, plus the one job they leave to you: the read, attached to every screen.Every one of them shows you something. None tells you what it means. Here’s the stack side by side against one place that does the assembling, plus the one job they leave to you: the read, attached to every screen.

The job to be done
MacroDesk
TradingView
Benzinga Pro
FinViz
Koyfin
The parts — most tools sell some of theseThe parts: most tools sell some of these
Charts & technical analysisdrawing, indicators, keyboard shortcuts
MacroDesk✓
TradingView✓
Benzinga✗
FinViz–
Koyfin–
Real-time news & audio feedheadlines the second they hit
MacroDesk✓
TradingView–
Benzinga✓
FinViz✗
Koyfin✗
Economic calendarscheduled data releases & events
MacroDesk✓
TradingView–
Benzinga✓
FinViz✗
Koyfin✓
Stock & ETF screenerfilters, maps, strategy tests
MacroDesk✓
TradingView–
Benzinga✗
FinViz✓
Koyfin–
Economy dashboardsinterest rates, currencies, company financials
MacroDesk✓
TradingView✗
Benzinga✗
FinViz✗
Koyfin✓
Every market type coveredfutures, currencies, crypto, commodities
MacroDesk✓
TradingView✓
Benzinga–
FinViz✗
Koyfin–
Alertsprice, news & event triggers
MacroDesk✓
TradingView–
Benzinga✓
FinViz–
Koyfin✗
The synthesis — the part no one else shipsThe joined-up read: the part no one else ships
The read: what the data meansa counted line, not a headline
MacroDesk✓
TradingView✗
Benzinga✗
FinViz✗
Koyfin✗
Market regime attachedevery read in context
MacroDesk✓
TradingView✗
Benzinga✗
FinViz✗
Koyfin✗
How often, and whenthe count and the dates on every line
MacroDesk✓
TradingView✗
Benzinga✗
FinViz✗
Koyfin✗
Two voicesanalyst shorthand or plain English
MacroDesk✓
TradingView✗
Benzinga✗
FinViz✗
Koyfin✗
"Explain this page" everywhereevery number broken down on tap
MacroDesk✓
TradingView✗
Benzinga✗
FinViz✗
Koyfin✗
Overlooked public datapolicy, shipping, how traders are positioned
MacroDesk✓
TradingView✗
Benzinga✗
FinViz✗
Koyfin✗

Keep the tools you love. MacroDesk replaces the job of stitching them together, not your charting hotkeys.Keep the tools you love. MacroDesk replaces the job of stitching them together, not your chart keyboard shortcuts.

See the full feature-by-feature comparison ›
Pricing

Pricing at launch.

MacroDesk charges no one today. The price will be set before launch and shown here first; no card is taken before then.

Join the waitlist
Questions

The honest answers.

Is this financial advice?+
No. MacroDesk is an information and decision-support platform, not a financial adviser. It shows what was filed and how often similar filings were followed by a sharp move, each with its count. It doesn’t tell you what to buy or sell, and nothing on it is personal advice. General information only; it does not consider your objectives, financial situation or needs.
What markets does it cover?+
Today: company announcements on the ASX, with the macro context around them from public sources — central banks and rates, the economic calendar and data, policy, futures positioning, shipping and stockpiles. US coverage and live prices open to subscribers only when their data licences allow it.Today: company announcements on the ASX, with the economic picture around them from public sources: central banks and interest rates, the economic calendar and data, policy, how futures traders are positioned, shipping and stockpiles. US coverage and live prices open to subscribers only when their data licences allow it.
What's the read actually based on?+
Counts. For each filing the scanner finds similar past filings and shows how many were followed by a sharp move at the next session, with n, the dates and the source filing. No forecast, no direction.Counts. For each announcement the scanner finds similar past ones and shows how many were followed by a big price move the next day, with how many, when, and a link to each. No prediction, no direction.
Is it for day traders or swing traders?+
Either. The scanner describes; it does not frame a trade for any holding period. What it shows (what followed similar filings at the next session, with the count) is the same for every reader.Either. The scanner describes what happened; it does not suggest a trade for any holding period. What it shows (what followed similar announcements the next day, with how often) is the same for every reader.
Who is it for?+
Serious traders who want the read, not the hype. People who’d rather see the reasoning and decide for themselves than be handed a buy or sell.
What will it cost?+
Pricing at launch. MacroDesk charges no one today; the price will be set before launch and shown on this page first, and no card is taken before then.
What happens when the next one goes the other way?+
A count describes the past; the next filing can go the other way, and often does. That is why every line shows its n and its dates, so you can see how much history stands behind it. MacroDesk informs your judgement; it does not replace it. The decision, and the risk, stay yours.A count describes the past; the next announcement can go the other way, and often does. That is why every line shows how often and when, so you can see how much history is behind it. MacroDesk informs your judgement; it does not replace it. The decision, and the risk, stay yours.
A morning radar for the ASX.

The next print drops with or without a read on your screen.The next data release drops with or without a read on your screen.

Make it yours.

Join the waitlist and we will tell you when access opens. Pricing at launch.